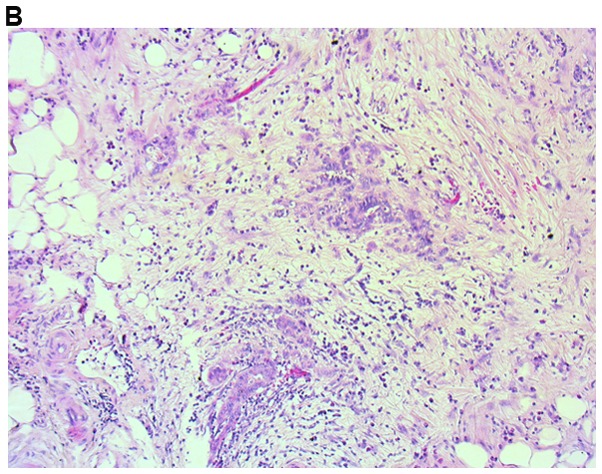
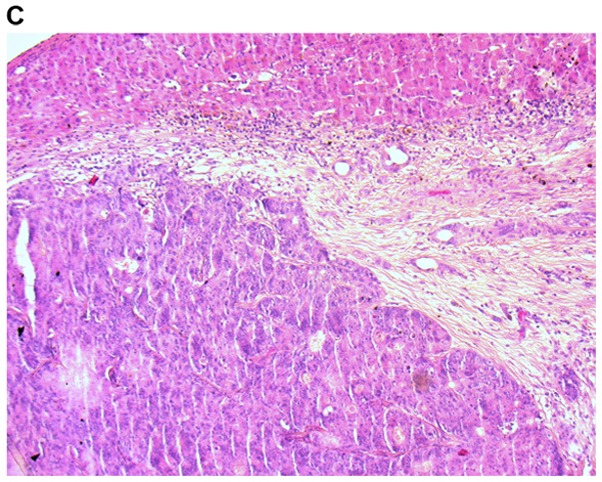
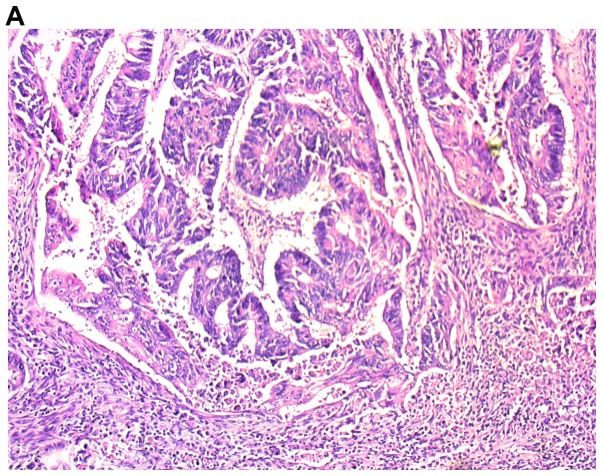
Figure 1.


Distribution of TILs. TIL distribution was observed (A) in the invasive front of primary tumor (strong cell infiltrate), (B) those surrounding deposits of cancer cells (weak cell infiltrate) and (C) in the invasive front of distant metastatic cells in the liver (weak cell infiltrate). Evaluation of TILs was performed using hematoxylin and eosin-stained sections. Magnification, ×200 in (A and C) and ×200 in (B) TILs, tumor-infiltrating lymphocytes.

