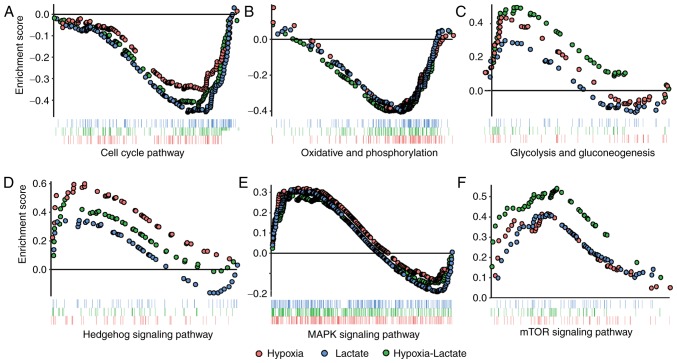
Figure 3.
GSEA for the lactate, hypoxia and hypoxia-lactate group. Pathways within the threshold of P<0.05 and false discovery rate <0.25 in at least one comparison were displayed using GSEA plots. The dots representing the genes in the hypoxia, lactate and hypoxia-lactate groups were colored in red, blue and green, respectively. (A) Cell cycle pathway. (B) Oxidative phosphorylation pathway. (C) Glycolysis and gluconeogenesis pathway. (D) Hedgehog pathway. (E) MAPK signaling pathway. (F) mTOR pathway. MAPK, mitogen-activated protein kinase; GSEA, gene set enrichment analysis.

