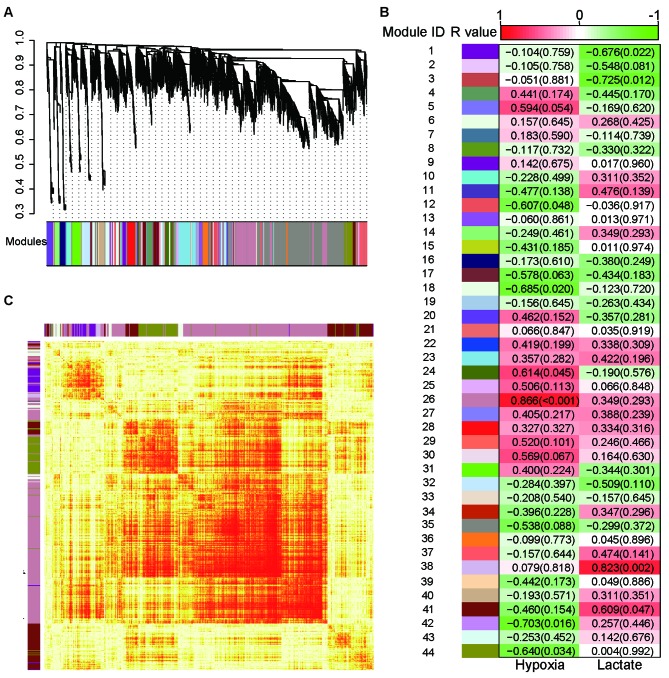
Figure 4.
Weighted gene co-expression network analysis. (A) All genes were hierarchically clustered according to the topological overlap matrix and displayed using a dendrogram. (B) Module-feature associations. Each row corresponds to a module eigengene and the two columns correspond to hypoxia and lactate treatment. Each cell contains the R-value (corresponding correlation) and the P-value in parentheses. The cells are colored depending on the R-value. (C) The topological overlap matrix among 1,000 randomly selected genes in the analysis was displayed using a heatmap. Light colors represent low overlap and progressively darker red color represents higher overlap.

