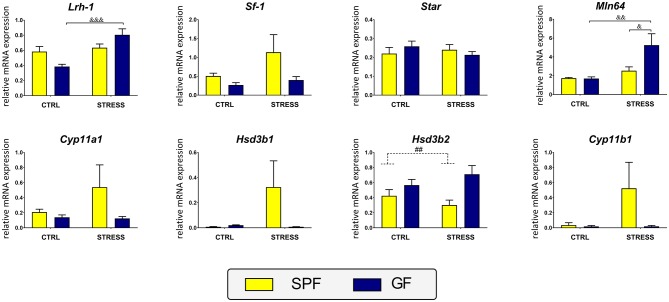
Figure 4.
Effect of microbiota and acute restraint stress on expression of genes participating in ileal steroidogenesis and its regulation. For further details, see the description of Figure 3. All data are expressed as mean ± SEM. Where an interaction effect was observed, the ampersand sign (&&&p < 0.001, &&p < 0.01, &p < 0.05) indicates a significant difference from the stressed GF mice. Where no interaction effect was observed, a main effect of microbiome has been identified by placing a dashed horizontal line with a hash sign (##p < 0.01) above the bars for the SPF groups. No main effects of stress were found in any of the analyses.

