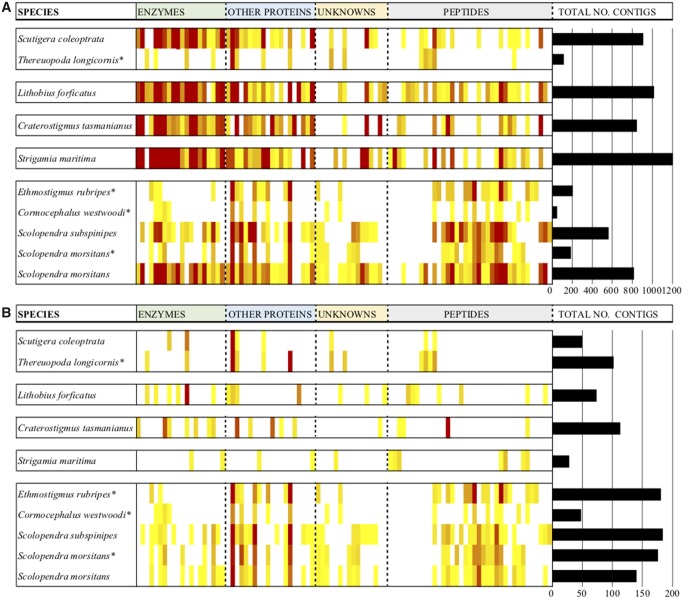
Fig. 2.
General composition of centipede venoms. The distribution of unique contigs encoding venom proteins and peptides in each family (columns) identified by (A) transcriptomics alone or (B) combined transcriptomics and venom proteomics are shown as heatmaps, whereas the total number of unique contigs identified in each species are shown as horizontal bars. The species are boxed according to their order (see fig. 1). The colors in the heatmap range from light yellow (indicating a single contig) to dark red (indicating a number within the 95th percentile, with maxima in the transcriptome [A] and proteome [B] data sets being 206 and 58 contigs, respectively). Asterisks mark species that were part of the study of Undheim, Jones, et al. (2014), with transcriptomes sequenced using Roche 454 technology. The other species were sequenced with Illumina technology. The full table used for generating the heatmap is provided as supplementary material S3 (Supplementary Material online).

