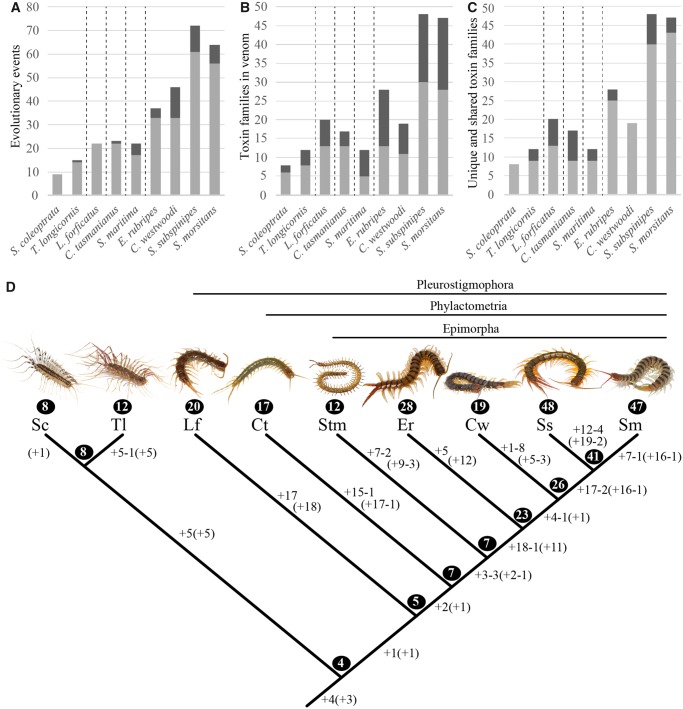
Fig. 3.
Comparison of evolutionary dynamics of venom composition between lineages. For each species, the graphs display the ACCTRAN estimations of (A) the total number of evolutionary events in the venom proteome since the last common centipede ancestor and how many of these are functional recruitments (light gray) or losses (dark gray), (B) the number of toxin families identified in the venom proteome and how many of these are proteins (light gray) or peptides (dark gray), and (C) the number of toxin families present in the venom proteome and how many of these are shared with at least one other species (light gray) or are unique to that species (dark gray). Dashed vertical lines demarcate orders. (D) The inferred numbers of functional recruitments (+) and losses (−) of toxin families from venom proteomes mapped onto the phylogeny of these species are indicated along the lineages, under both ACCTRAN and DELTRAN (numbers in parentheses) optimization. The number of toxin families identified in the venom of each species and those reconstructed to be present in the hypothetical ancestral venoms are indicated in circles. Abbreviations of species names are as follows: Sc, Scutigera coleoptrata; Tl: Thereuopoda longicornis; Lf: Lithobius forficatus; Ct: Craterostigmus tasmanianus; Stm: Strigamia maritima; Er: Ethmostigmus rubripes; Cw: Cormocephalus westwoodi; Ss: Scolopendra subspinipes; Sm: Scolopendra morsitans.

