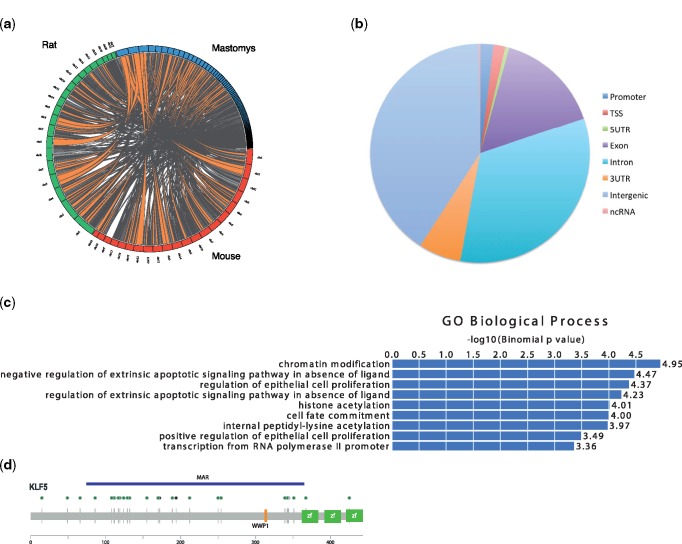
Fig. 2.
Comparative genomics. (a) Synteny comparisons between mastomys-mouse-rat. A circos plot showing chromosomal segments (in orange) that are conserved between mastomys (blue), mouse (red), and rat (green). (b) Pie chart showing the different genomic locations of MARs. (c) GREAT analysis for MARs showing their GO biological process. (d) Diagram showing the location of the coding MAR178 within the Klf5 protein. Green circles mark nonsynonymous protein changes and black circles mark amino acid insertions in mastomys. The orange line represents the ubiquitin binding domain (WWP1) and the green rectangles represent the zinc finger binding domains. The blue line shows the location of MAR178, which overlaps exon 2 of the Klf5 gene.

