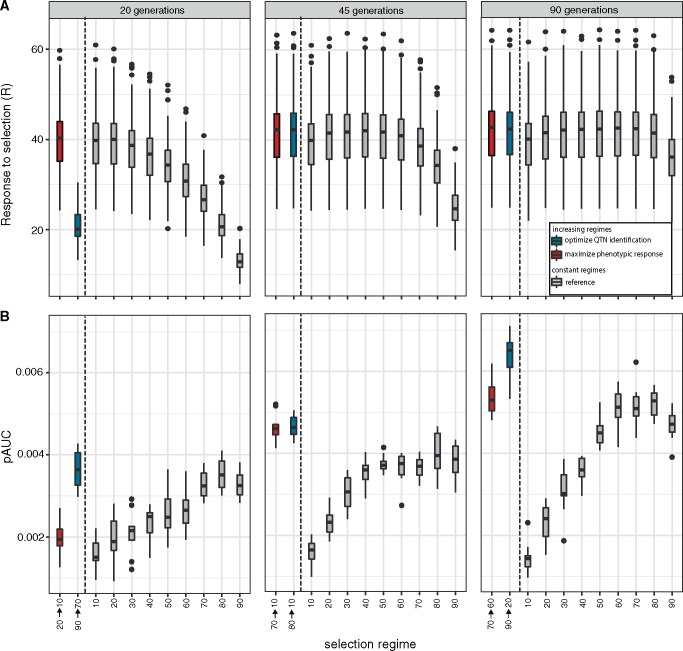
Fig. 5.
Selection regimes that maximize the power to identify QTNs (blue) are not necessarily identical to regimes that maximize the phenotypic response to selection (red). As a reference the performance of constant selection regimes (gray) is shown. (A) Phenotypic response to selection. (B) Power to identify the QTNs assessed by the partial AUC (highest possible performance pAUC = 0.01).

