Fig. 1.
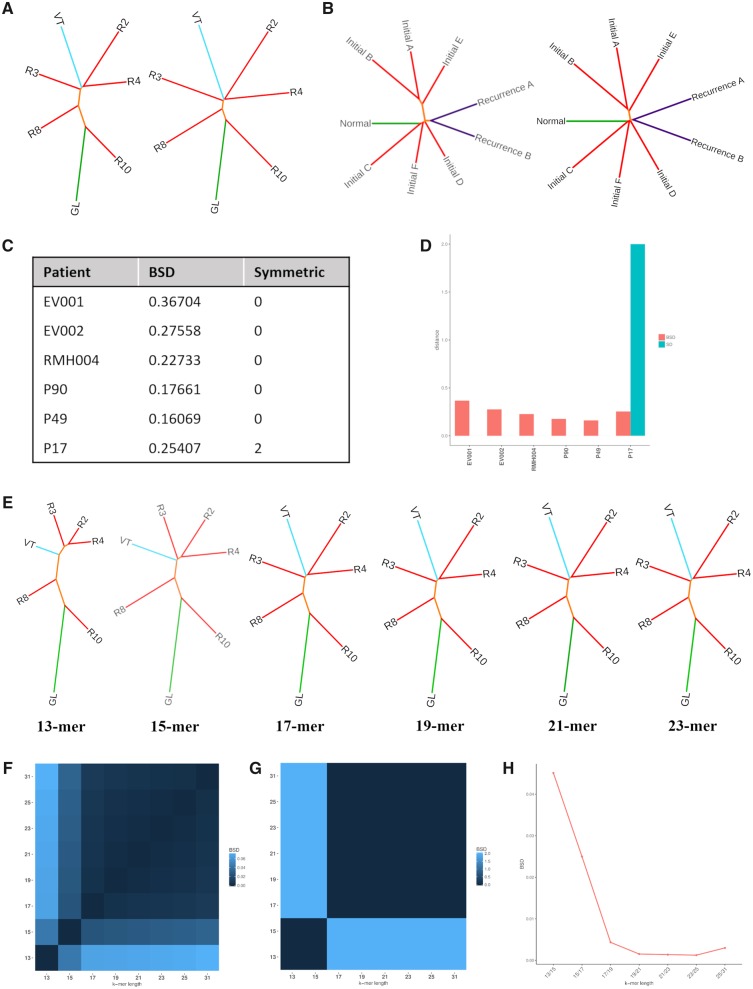
Identifying optimal parameters for use with alignment-free. Application of Jensen–Shannon divergence (JSD) and Hellinger Distance (HD) to (A) clear cell renal cell carcinoma (ccRCC) patient RMH004 with a germline sample (GL), multiple samples from the ccRCC tumor (R2-4, R8, R10) and a tumor thrombus from the renal vein (VT) and (B) glioma patient P90 with a germline sample (Normal), multiple samples from the initial grade II glioma (Initials A–F) and two samples from a recurrent grade II glioma (Recur 1A and 1B). (C) A table summarizing branch-score distance (BSD) and symmetric distance (SD) values returned when comparing trees for six patients for which both JSD and HD have been applied. (D) A bar chart summarizing BSD and SD values returned when comparing trees for six patients for which both JSD and HD have been applied. (E) Tree topologies produced using k-mer lengths 13, 15, 17, 19, 21, and 23 in combination with JSD when applying alignment-free methods to patient RMH004. (F) A heatmap representing the BSD between trees produced using varying k-mer lengths and HD applied to patient RMH004. (G) A heatmap representing the BSD between trees produced using varying k-mer lengths and JSD applied to patient RMH004. (H) A line graph representing the BSD between trees produced using increasing k-mer lengths when applying JSD.

