
Figure 1.
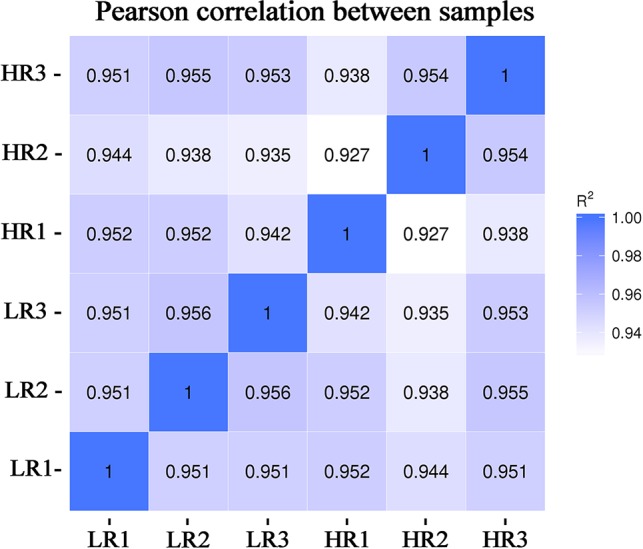
Chart of the expression correlation between samples. Data for six samples, comprising three samples with very high-RFI values and three samples with very low-RFI values, are presented. The horizontal coordinate of the correlation coefficient between samples is log10(FPKM+1) of sample 1, the ordinate is log10(FPKM+1) of sample 2, and R2 is the square of Pearson's correlation coefficient. FPKM—fragments per kilobase of exon per million fragments mapped.