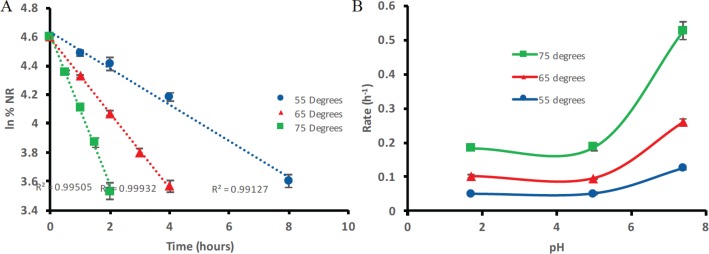
Fig. 5.
(A) The average (n = 5) natural log first-order kinetic plots of NRCl degradation at 55°C, 65°C, and 75°C, respectively, at pH 7.4. (B) Overlay of the observed rate/pH profiles at 55°C, 65°C, and 75°C, respectively. Exponential relationship can be seen. Error bars represent standard deviation.

