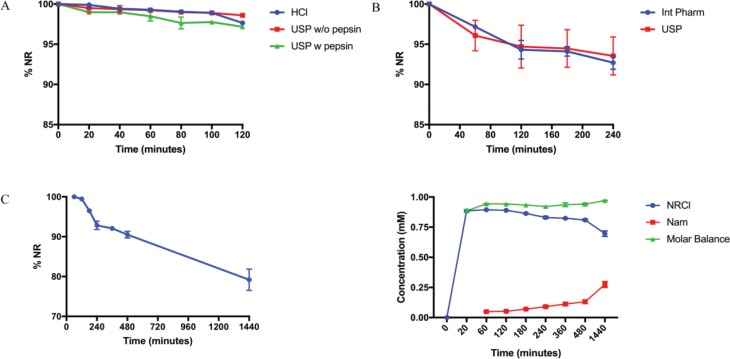
Fig. 6.
(A) The stability of NRCl in three different gastric simulated fluids over time with %NR describing NRCl stability. Each point represents n = 3 with errors bars for standard deviation. (B) The stability of NRCl in two simulated intestinal fluids over time with %NR describing NRCl stability. Each point represents n = 3 with errors bars for standard deviation. (C) The stability of NRCl in GI simulated fluids over 24 h. (D) The stability of NRCl (blue), occurrence of Nam, and the molar balance between the two species in GI simulated fluids over 24 h shown in molar values (mM).

