
Figure 4:
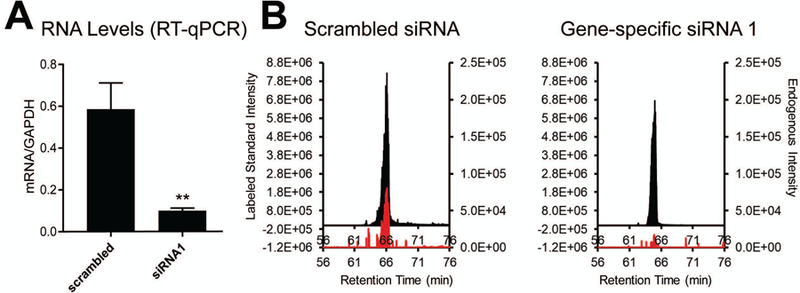
A. Levels of target transcript after transfection either with a scrambled control or gene-specific siRNA. Relative RNA levels are quantified with RT-qPCR and normalized to non-changing control GAPDH. B. MS1 peaks of targeted proteotypic peptide after transfection with scrambled or gene-specific siRNA. Equal concentrations of peptide standard were spiked into each sample. 2 µg cell lysate were used per injection.