
Figure 1.
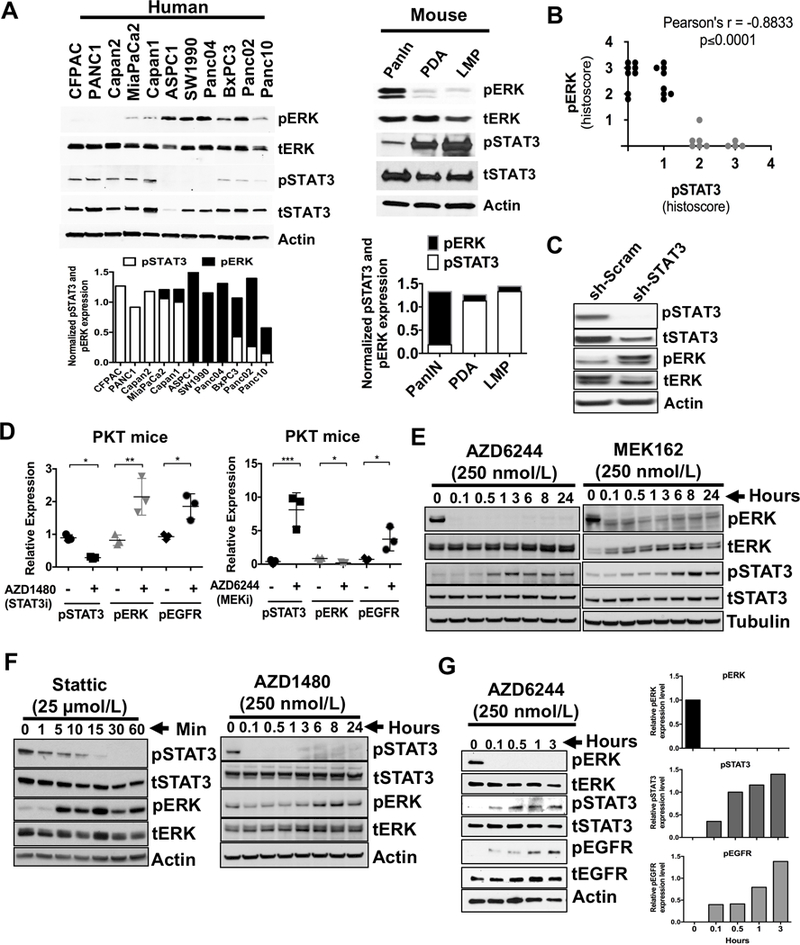
Inverse correlation of ERK and STAT3 in PDAC. A, expression of activated and total levels of ERK and STAT3 in cell lines from human PDAC (left panel) or cells generated from pancreatic intraepithelial neoplasia (PanIN), primary PDAC (PDA) and liver metastatic (LMP) lesions from LSL-KrasG12D/+;Pdx1Cre/+ (PanIN) and LSL-KrasG12D/+;Trp53R172H/+;Pdx1Cre/+ (PDA and LMP) mice (right panel) are demonstrated. Densitometry analyses of pSTAT3 and pERK normalized to tSTAT3 and tERK respectively were shown in the bottom panels of A. B, selected human PDAC tumor samples were stained for pERK and pSTAT3 expression. Pearson correlation showed negative correlation for pERK and pSTAT3 expression. r = −0.8833, p ≤ 0.0001. C, sh-STAT3 and sh-scrambled (sh-Scram) control cell lysates were analyzed for pSTAT3 and pERK expression by Western blot. D, tumors tissues from PKT mice treated with STAT3 inhibitor AZD1480 (left panel) or MEK inhibitor AZD6244 (right panel) were analyzed for pERK, pEGFR or pSTAT3 expression respectively by immunohistochemistry and analyzed using Image J. E, Western blot of lysates from MiaPaCa2 cells were treated with AZD6244 or MEK162 (MEK inhibitor) in time-dependent manner. F, Western blot of lysates from MiaPaCa2 cells were treated with STAT3 inhibitors Stattic (left panel) or AZD1480 (right panel) in time dependent manner. G, Western blot of lysates from SW1990 cells treated with MEKi (AZD6244) in time (left panel) -dependent manner and analyzed for the levels of pERK, pSTAT3 and pEGFR (right panels). Densitometry analyses of pERK, pSTAT3 and pEGFR normalized to tERK, tSTAT3 and tEGFR respectively. *, P < 0.05; **, P < 0.01; ***, P < 0.001.