Figure 3.

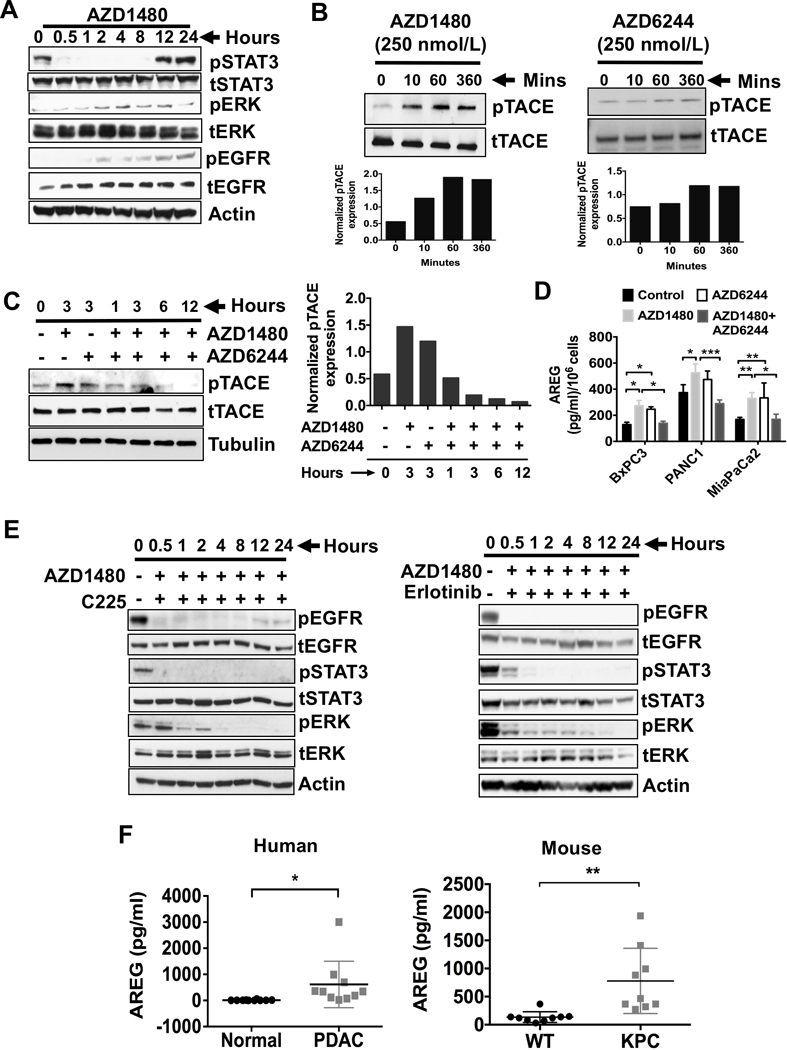
STAT3i results in ERK phosphorylation, which occurs through TACE-AREG-EGFR signaling. A, Western blots of human MiaPaCa2 cells treated with JAK/STAT3 inhibitor (AZD1480, 100 nmol/L) and analyzed for the expression of pERK, pSTAT3 and pEGFR in time dependent manner. B, MiaPaCa2 Cells were treated with AZD1480 (250 nmol/L, left panel) or AZD6244 (250 nmol/L, right panel) for up to 360 minutes, immunoblotted for TACE and pTACE (T735). Densitometry analyses of pTACE normalized to tTACE was shown in the bottom panels of B. C, MiaPaCa2 cells were treated with AZD1480 (250 nmol/L) and/or AZD6244 (250 nmol/L) for up to 12 hours, immunoblotted for pTACE (left panel). Densitometry analyses for the immunoblots from pTACE after normalization to total TACE protein are shown (right panel). Densitometry analyses of pTACE normalized to tTACE was shown in the bottom panels of C. D, PDAC cells were treated with AZD1480 (100 nmol/L) and/or AZD6244 (250 nmol/L) for 48 hours and analyzed for AREG release in the culture media (concentrations per 1 × 10⁶ cells). Each value represents the mean and SD (n = 3). E, MiaPaCa2 cells were treated with AZD1480 (100 nmol/L) with or without Cetuximab (C225), monoclonal antibody to EGFR (4 microgram/ml) (left panel) or EGFR kinase inhibitor erlotinib (1 microgram/ml) (right panel) for up to 24 hours, lysed and immunoblotted for pSTAT3 and pERK. F, Serum AREG (pg/ml) levels from normal and PDAC patients were analyzed (left panel). Serum AREG (pg/ml) levels from wildtype (WT) and KPC mice were analyzed (right panel). *, P < 0.05; **, P < 0.01; ***, P < 0.001.
