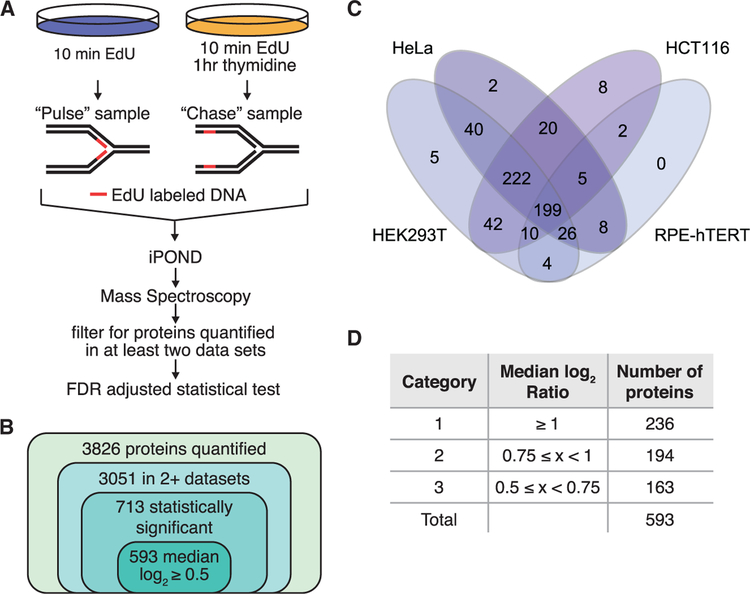
Figure 1. 593 Proteins Are Significantly Enriched at Replication Forks.
(A) Schematic for identifying proteins enriched at nascent DNA. Cells treated with 10 min of EdU were compared to cells treated with 10 min of EdU followed by a 1-h chase in thymidine by iPOND-SI-LAC-MS.
(B) A total of 3,826 proteins were quantified in at least one experiment and 3,051 in at least two. A total of 713 of the 3,051 proteins were significantly enriched by a 5% FDR-adjusted t test, and applying an abundance ratio cutoff of log2 ≥ 0.5 yielded 593 proteins.
(C) Venn diagram depicting how many of the 593 proteins were identified with a median log2 ratio ≥ 0.5 in each cell type.
(D) Proteins were assigned to categories based on median log2 abundance ratios.
See also Figure S1.

