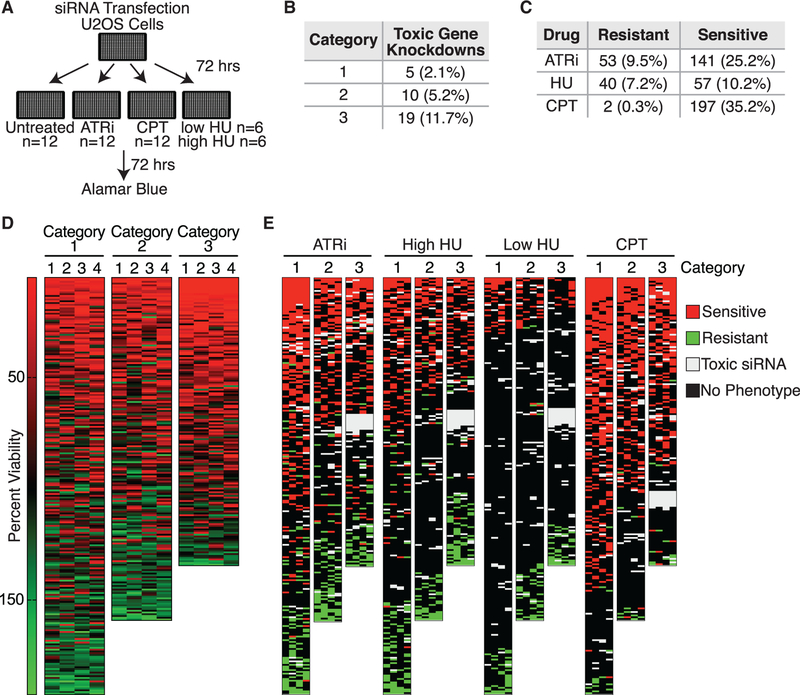
Figure 3. Loss-of-Function Screens Identify Proteins Important for the Response to Replication Stress.
(A) Schematic for performing loss-of-function screens. Genes were considered hits if 2 or more of the 4 siRNAs yielded the same effect.
(B) Number of gene knockdowns resulting in viability less than 5% of control.
(C) Numbers of gene knockdowns resulting in resistance or sensitivity to ATRi, CPT, and HU.
(D) Heatmaps of the average viability of cells transfected with each siRNA as compared to a control siRNA in the absence of added replication stress. Each row is a single gene and each column is one of four siRNAs.
(E) Average viability of cells transfected with each siRNA and treated with the indicated drugs as compared to a control siRNA.
See also Figure S3.

