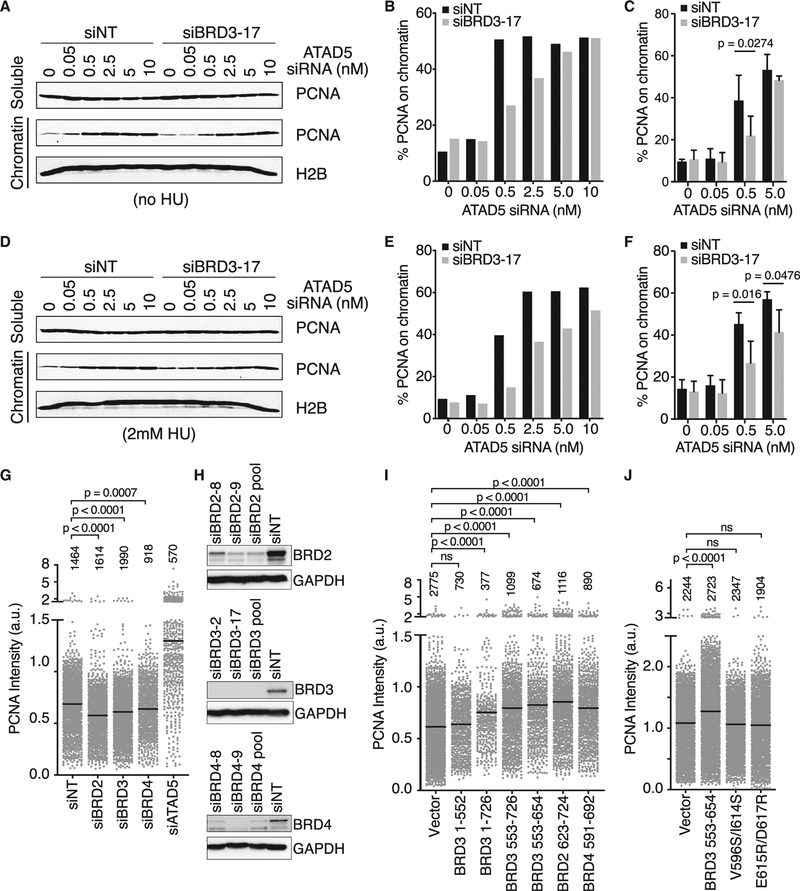
Figure 7. BET Proteins Regulate the Levels of PCNA on Chromatin.
(A–F) The soluble and chromatin fractions of S-phase synchronized U2OS cells transfected with the indicated siRNAs were immunoblotted for PCNA and H2B.
(A) Representative immunoblot from untreated cells transfected with the indicated siRNAs.
(B) Quantification of the percent of PCNA in the chromatin fraction in (A).
(C) Quantification of three independent experiments. Mean ± SD, two-way ANOVA corrected for multiple comparisons using the Bonferroni method.
(D–F) Repeat of experiments as in (A)–(C) but with 2-mM HU treatment for 1 h prior to harvesting cells.
(G) Intensity of detergent-resistant PCNA immunofluorescence in S-phase cells transfected with the indicated siRNA pools. Number of cells analyzed in each column is indicated (representative of n = 6 replicates, mean indicated by bar, ANOVA with Dunnett post-test).
(H) Immunoblot analysis to verify siRNA knockdown efficiencies.
(I and J) Intensity of detergent-resistant PCNA in S-phase cells transfected with plasmids encoding the indicated (I) fragments or (J) mutants. Only GFP-positive cells were included in the analysis. Number of cells analyzed in each column is indicated (n = 3 technical replicates, representative of n = 2 biological replicates, mean indicated by bar, ANOVA with Dunnett post-test).
See also Figures S4 and S5.

