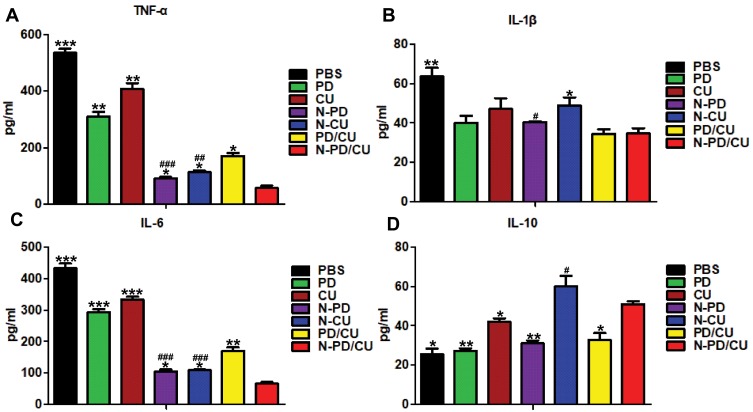
Figure 4.
Expression of pro-inflammatory cytokines and anti-inflammatory cytokine in cell-free supernatant of activated macrophage treated with different preparations. Levels of (A) TNF- α, (B) IL-1β, (C) IL-6 and (D) IL-10 were assayed. Data shown are mean ± SD (n=3). *p<0.05, **p<0.001, ***p<0.0001 vs cells treated with N-PD/CU, #p<0.05, ##p<0.001, ###p<0.0001 vs cells treated with PBS.

