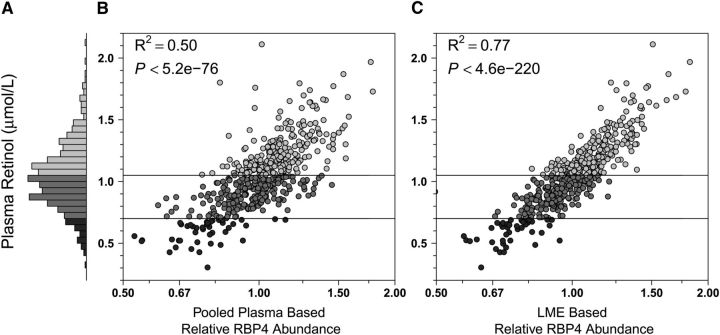
FIGURE 1.
Plasma retinol and RBP4 relative abundance distributions in Nepalese children 6–8 y of age (n = 500). (A) Histogram showing the frequency distribution of retinol concentrations: range = 0.30–2.11 μmol/L, 8.8% (n = 44) deficient (<0.70 μmol/L, dark gray), 45.6% (n = 228), marginal (0.70 to <1.05 μmol/L, medium gray), and 45.6% (n = 228) adequate (≥1.05 μmol/L, light gray) in status. (B) Plasma retinol by relative abundance of RBP4 by a traditional estimation method using a master plasma pool in one randomly assigned iTRAQ channel within each 8-plex experiment to normalize the protein distribution across iTRAQ runs. (C) Plasma retinol by relative abundance of RBP4 by an estimation method that relies on an LME model that combines abundance estimates from all 72 iTRAQ experiments (25). R2 values represent the proportion of variance in the nutrient explained by the fitted values of the nutrient-protein regression models. The P value in B is derived from testing the hypothesis of no association between the nutrient and protein abundance, whereas the P value in C is derived from testing the fixed effects slope for the protein abundance in the LME model. Shading of circles in B and C corresponds to bars. Horizontal lines indicate cutoffs for changes in micronutrient status. iTRAQ, isobaric tags for relative and absolute quantification; LME, linear mixed effects (model); RBP4, retinol binding protein isoform 4.

