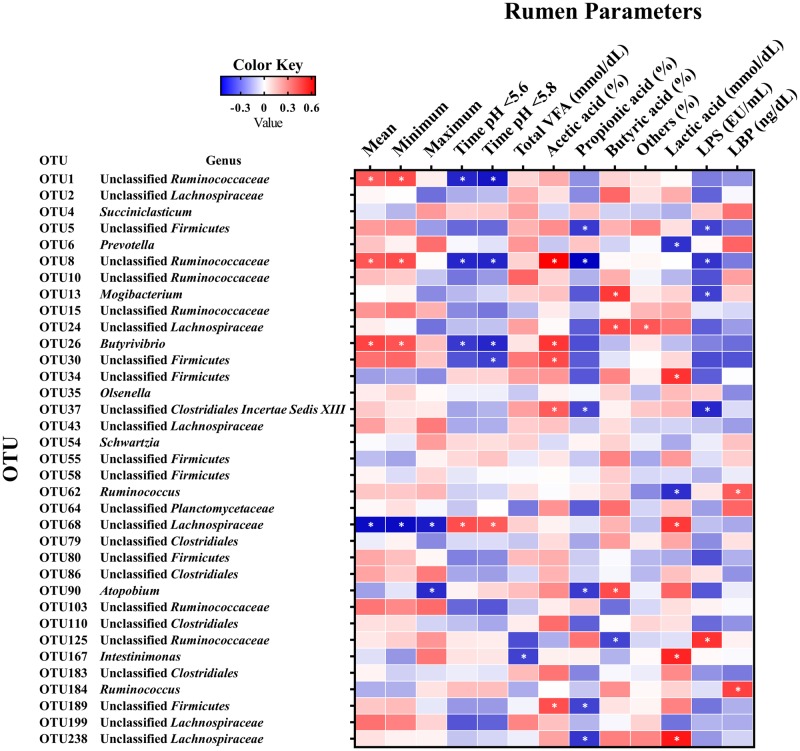
Fig 5. Correlation analyses between the core OTUs (shared by all samples) and rumen parameters.
Cells are colored based on Pearson correlation analyses. Blue represents a negative correlation and red represents a positive correlation. *significant correlation between OTUs and rumen parameters at P < 0.05. Mean = 24-h mean ruminal pH; Minimum = 24-h minimum ruminal pH; Maximum = 24-h maximum ruminal pH; Time pH < 5.6 = duration of time where pH < 5.6; Time pH < 5.8 = duration of time where pH < 5.8; LPS = lipopolysaccharide; LBP = lipopolysaccharide-binding protein.

