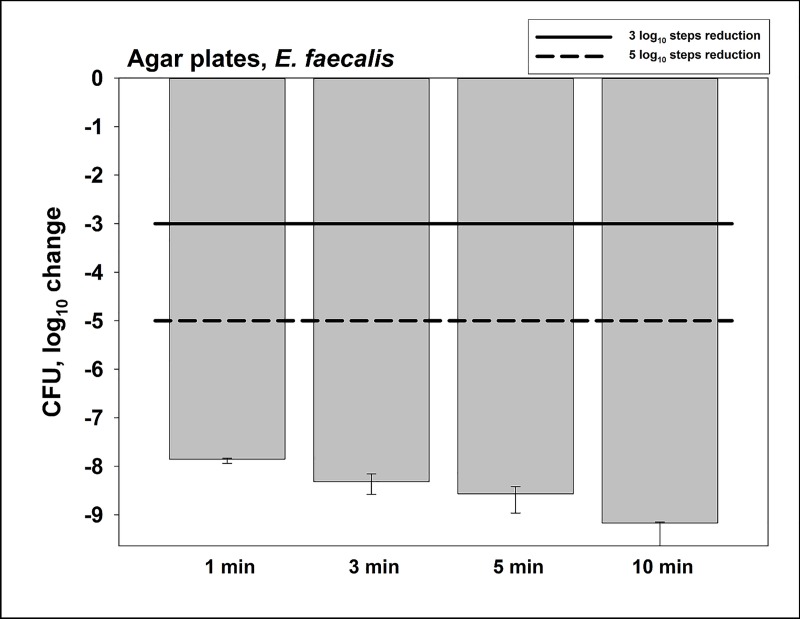
Fig 2. Antimicrobial assay towards planktonic E. faecalis on agar plates.
CAP was performed for different treatment periods. Surviving colonies were counted 24 h later. All results are depicted as medians, 1st and 3rd quartiles from six independent experiments in duplicates on a log10-scaled ordinate. Bars show the reductions of CFU in a log10 scale in comparison to untreated controls. Solid and dashed lines exhibit 3 log10 steps (99.9%) or 5 log10 steps reduction (99.999%) of CFU, respectively. (n = 6; untreated controls exhibited 7.3 x 10¹⁰ CFU in median).

