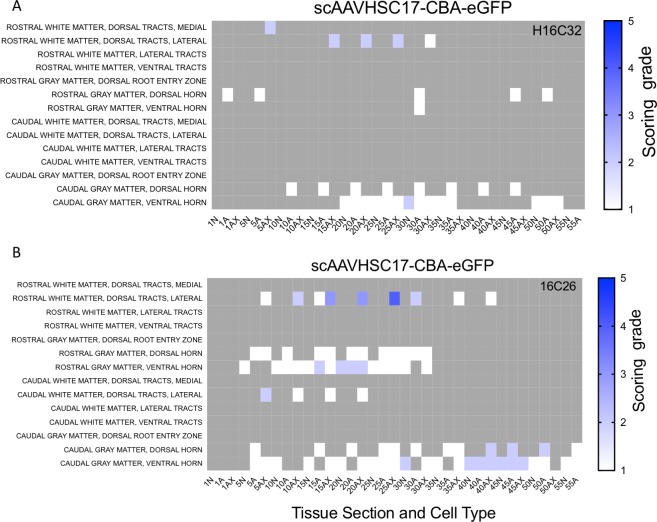
Fig 10. Heat maps of eGFP staining intensity within glia, neurons and neuronal axons in spinal cords of Cynomolgus macaques treated with IV scAAVHSC17-CBA-eGFP.
(A) Animal H16C32 received an IV injection of scAAVHSC17-CBA-eGFP. (B) Animal 16C26 was treated with an IV injection of scAAVHSC17-CBA-eGFP. Each animal was dosed at 1.0 x 10¹⁴ vg/kg. All sections were scored in a blinded manner as described under Materials and methods. Only the rostral and caudal portions of the spinal cords were available for analysis. The percent of cell type stained per structure on each slide was grade 1: <1%, grade 2: 1–5%, grade 3: 5–15%, grade 4: 15–40%, and grade 5: >40%. Grey areas represent those areas where either no cord structure was present or no eGFP staining was seen. The numbers below each heat map represent the spinal cord sections with N = neurons, Ax = axons and A = glia. Animal identifiers are in the upper right of each panel.

