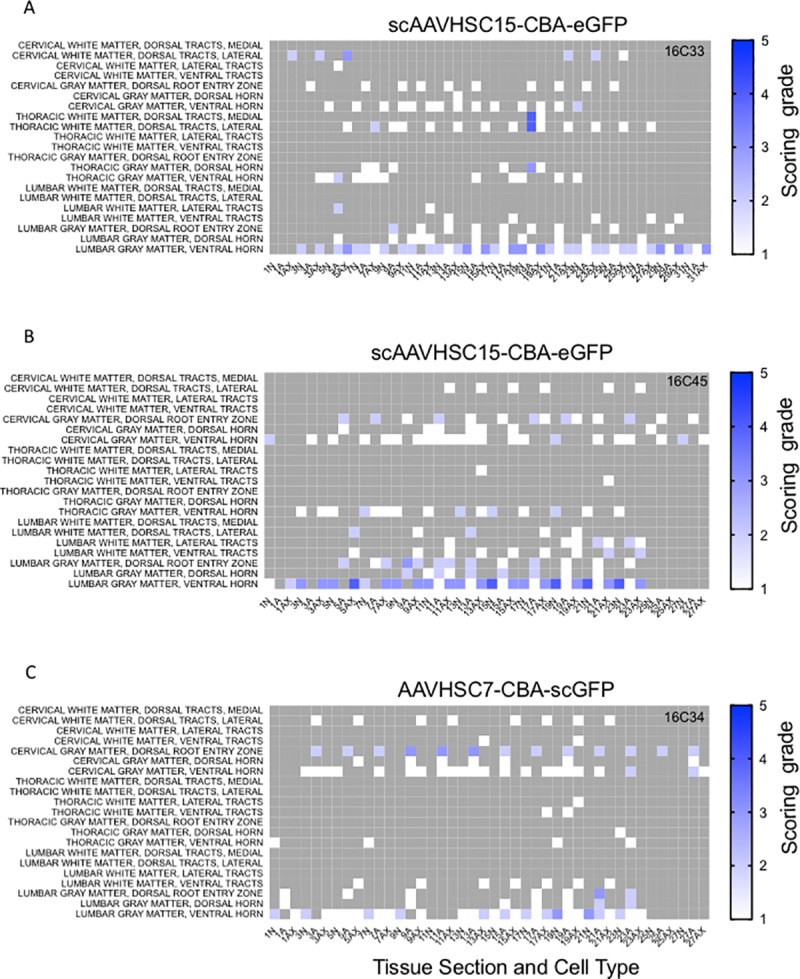
Fig 11. Heat maps of eGFP staining intensity within glia, neurons and neuronal axons in spinal cords of Cynomolgus macaques treated with IV scAAVHSC-CBA-eGFP.

(A) Animal 16C33 was treated with an IV injection of scAAVHSC15-CBA-eGFP. (B) Animal 16C45 received an IV injection of scAAVHSC15-CBA-eGFP. (C) Animal 16C34 was treated with an IV injection of scAAVHSC7-CBA-eGFP. All animals were dosed at 0.7 x 10¹⁴ vg/kg. All sections were scored in a blinded manner as described under Materials and methods. The percent of cell type stained per structure on each slide was grade 1: <1%, grade 2: 1–5%, grade 3: 5–15%, grade 4: 15–40%, and grade 5: >40%. Grey areas represent those areas where either no cord structure was present or no eGFP staining was seen. The numbers below each heat map represent the spinal cord sections with N = neurons, Ax = axons and A = glia. Animal identifiers are in the upper right of each panel.
