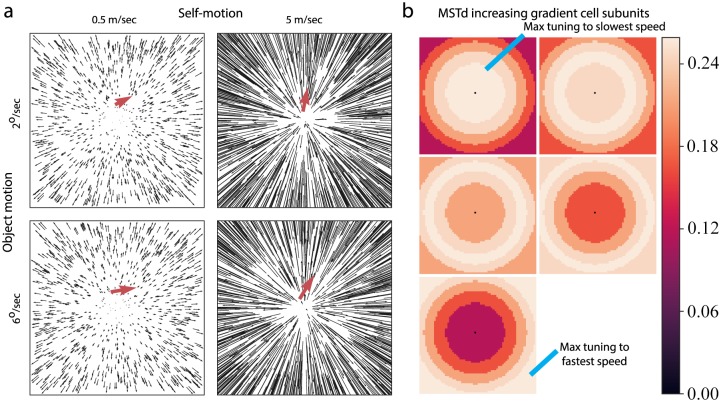
Fig 4.
(a) Fronotoparallel displays used in Simulation 1. Optic flow depicting simulated self-motion at different rates of approach toward a frontoparallel plane of dots. The red arrow depicts the retinal motion of a small moving object. We scaled the length of the object vector 3x for visibility. (b) Model MSTd gradient cell RF subunits corresponding to sensitivity to the five different model MT peak speeds, which span the dynamic range across all frontoparallel stimuli (i.e. not necessarily any particular display). Increasing gradient cells prefer an increasing speed gradient and have the region of maximum sensitivity to the slowest (fastest) speed near the center (periphery) of the RF. The speed gradients in (a) stimulate a subset of the gradient cell annular subunit regions. Connection weights are depicted before normalization.

