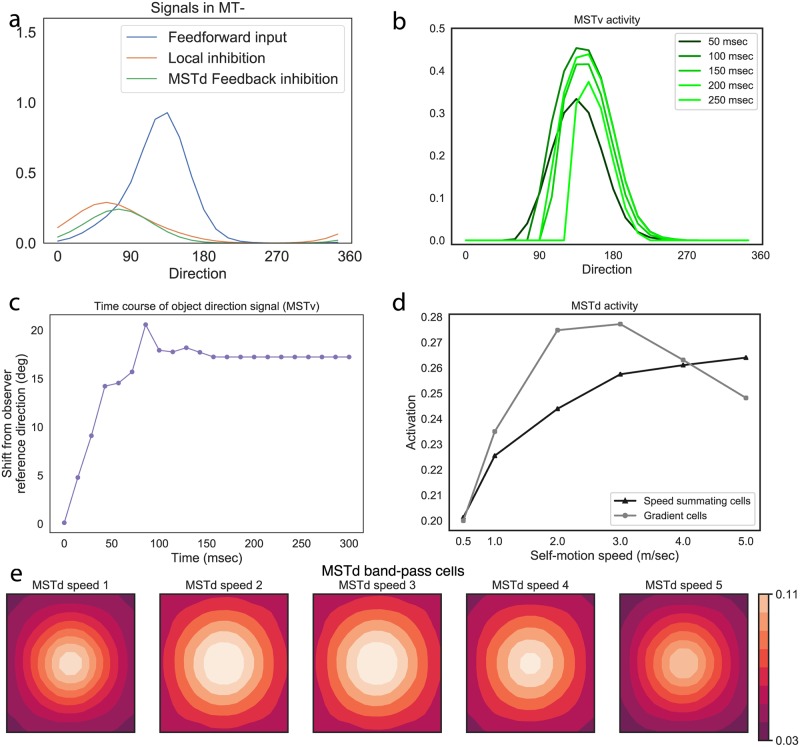
Fig 6.
(a) Object motion signals in MT− during fronotoparallel plane simulation. Blue is the object motion signal in MT−, green is the inhibitory feedback signal from MSTd, red is the surround (local) inhibition within MT−. y-axis is activation, x-axis is direction (0-360 deg in 15 deg increments). (b) Shift in the MSTv activity distribution over time (MT− demonstrates a qualitatively similar evolution). (c) Time course of object motion direction represented by area MSTv units. A zero shift value indicates object motion in a observer-relative reference; positive values indicate shifts in the world-relative direction. Self-motion speed is 1 m/sec and object motion speed is 6°/s. (d) Activation of the most active gradient (gray) and speed summating (black) MSTd cells for the different self-motion speeds from the Experiment 1 frontoparallel plane stimuli. (e) MSTd band-pass cell activity that reflects an estimate of observer’s self-motion direction. The x and y axes correspond to the spatial coordinates of the optic flow. The overall activation is weak and variance in the distribution is high, indicating uncertainty in the self-motion estimate.

