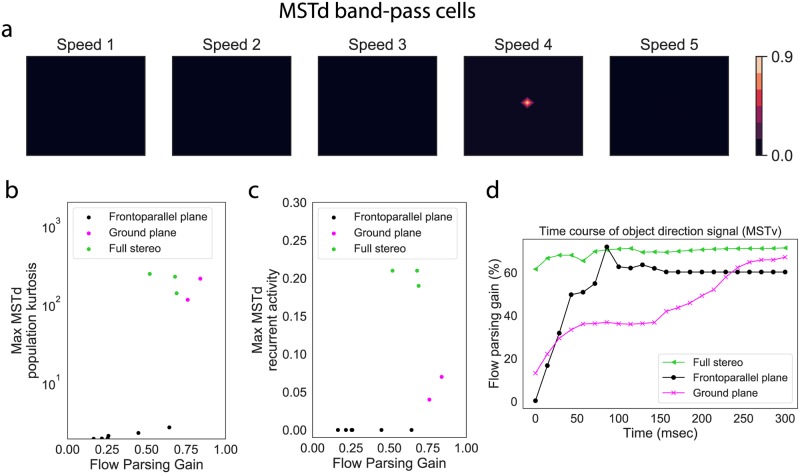
Fig 11.
(a) MSTd band-pass cell activity for the Full Stereo condition. (b) Kurtosis of the most active MSTd subpopulation response, which measures the peakedness of distribution, in each simulation. (c) Strength of the recurrent signal generated by the most active MSTd subpopulation in each simulation (Eq. S21). A zero value in this panel indicates that the MSTd signal did reach the appropriate threshold to engage the recurrent mechanism. (d) Time course of the object direction signal in model MSTv. Black and blue curves reproduced from Fig 9d.

