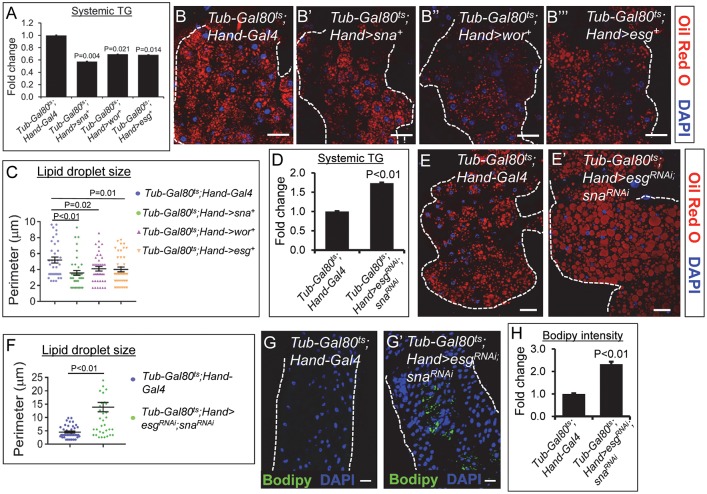
Fig 4. Overexpression or inhibition of Snail TFs in post-natal hearts only promotes overall leanness or obesity, respectively.
(A) Whole-body TG level of 3-week old control flies (Tub-Gal80ts; Hand-Gal4) and flies that overexpress Sna TFs in postnatal hearts only (Tub-Gal80ts; Hand>sna+ or Tub-Gal80ts; Hand>wor+ or Tub-Gal80ts; Hand>esg+). TG levels (μg/μl) were normalized to total protein (μg/μl). Results are the mean ± SEM of 30–40 flies analyzed over at least 3 independent experiments and are expressed as the fold change normalized TG compared with that of the control flies (set to 1.0). (B-B”‘) Representative confocal images of abdominal fat bodies stained with Oil Red O (red) and DAPI (blue) from 3-wk-old control flies (B) and flies that overexpress Sna TFs in postnatal hearts only (B’-B”‘). For each genotype, 6 fat bodies were analyzed. Dotted lines mark the outlines of fat bodies. Scale bar represents 20 μm. (C) Lipid droplet size quantification in fat bodies from control flies and flies that overexpress Sna TFs in postnatal hearts only. 40 lipid droplets were analyzed from 6 fat bodies per genotype and results are represented as mean ± SEM. (D) Whole-body TG level of 7-day old control flies (Tub-Gal80ts; Hand-Gal4) and flies with SnaTF gene knockdowns in postnatal hearts only (Tub-Gal80ts; Hand>esgRNAi, snaRNAi or Tub- Gal80ts; Hand>esgRNAi, worRNAi). TG levels (μg/μl) were normalized to total protein (μg/μl). Results are the mean ± SEM of 30–40 flies analyzed over at least 3 independent experiments and are expressed as the fold change normalized TG compared with that of the control flies (set to 1.0). (E-E”) Representative confocal images of abdominal fat bodies stained with Oil Red O (red) and DAPI (blue) from 7-day-old control flies (E) and flies with Sna TF gene knockdowns (E’) in postnatal hearts only. For each genotype, 6 fat bodies were analyzed. Dotted lines mark the outlines of fat bodies. Scale bar represents 20 μm. (F) Lipid droplet size quantification in fat bodies from control flies and flies with Sna TF gene knockdowns in postnatal hearts only. 40 lipid droplets were analyzed from 6 fat bodies per genotype and results are represented as mean ± SEM. (G-G’) Representative confocal images of intestines stained with Bodipy (green) and DAPI (blue) from 7-day-old control flies (G) and flies with Sna TF gene knockdowns (G’) in postnatal hearts only. For each genotype, 6 intestines were analyzed. Dotted lines mark the outlines of intestinal tubes. Scale bar represents 20 μm. Region 1 (R1) to R3 (hairpin region) of the Drosophila midgut was analyzed for Bodipy staining. (H) Bodipy fluorescence quantification in intestines from control flies and flies with Sna TF gene knockdowns in postnatal hearts only. Three separate areas were analyzed from each of 6 intestines per genotype and results are represented as mean ± SEM.

