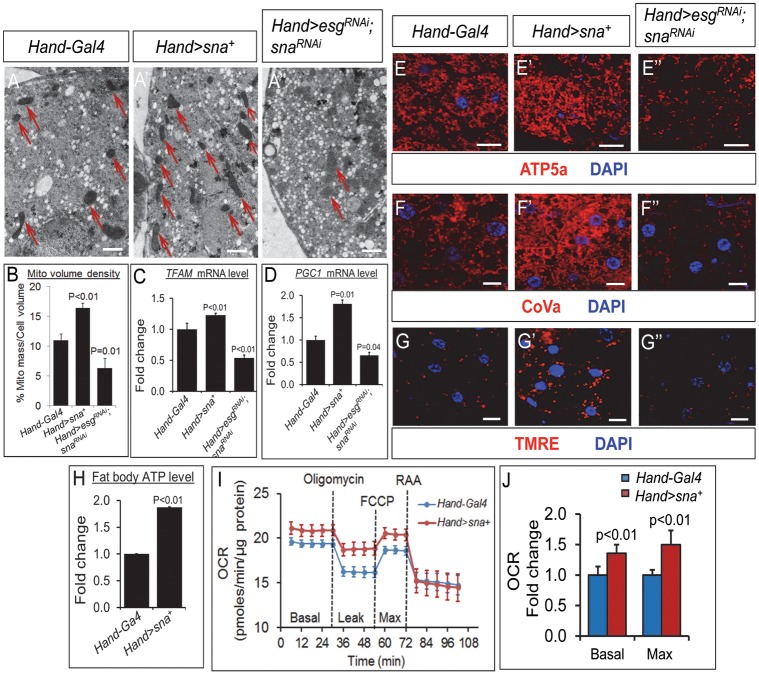
Fig 7. Mitochondrial biogenesis and function in the fat body are perturbed by cardiac- specific manipulations of Snail TF levels.
(A-A”) Representative images of transmission electron micrographs of the fat body of control flies (A), flies with cardiomyocyte-specific overexpression of Sna (Hand>sna+) (A’), and flies with cardiomyocyte-specific knockdown of Snail TF genes (Hand>esgRNAi; snaRNAi) (A”) showing mitochondria as electron dense structures (red arrows). Magnification = 2500X. Scale bar = 1 μm. (B) Quantification of mitochondrial volume density (% of cell volume occupied by mitochondria) in the fat body of control flies, flies with cardiomyocyte-specific overexpression of Sna (Hand>sna+), and flies with cardiomyocyte-specific knockdown of Snail TF genes (Hand>esgRNAi; snaRNAi). Fat bodies from 10 adult flies were analyzed per genotype. (C-D) Relative mRNA level of mitochondrial biogenesis genes TFAM (C) and PGC-1/spargel (D) in fat bodies of control flies (Hand-Gal4), flies with cardiomyocyte-specific overexpression of Sna (Hand>sna+), and flies with cardiomyocyte-specific knockdown of Sna TF genes (Hand>esgRNAi; snaRNAi). Results are the mean ± SEM of 60 fat bodies analyzed over 3 independent experiments and are expressed as the fold change compared with control fat bodies (set to 1.0). (E-E”) Representative confocal images of abdominal fat bodies immunostained for the mitochondrial ATP synthase subunit ATP5A (red) and co-stained with DAPI (blue) from 7-day- old control flies (Hand-Gal4) (E), flies with cardiomyocyte-specific overexpression of Sna (Hand>sna+) (E’), and flies with cardiomyocyte-specific knockdown of Snail TF genes (Hand>esgRNAi; snaRNAi) (E”). For each genotype, 6 fat bodies were analyzed. Scale bar represents 20 μm. (F-F”) Representative confocal images of abdominal fat bodies immunostained for the mitochondrial Cytochrome c oxidase subunit 5A/CoVa (red) and co-stained with DAPI (blue) from 7-day-old control flies (Hand-Gal4) (F), flies with cardiomyocyte-specific overexpression of Sna (Hand>sna+) (F’), and flies with cardiomyocyte-specific knockdown of Snail TF genes (Hand>esgRNAi; snaRNAi) (F”). For each genotype, 6 fat bodies were analyzed. Scale bar represents 20 μm. (G-G”) Representative confocal images of abdominal fat bodies stained with the TMRE dye for mitochondrial membrane potential detection (red) and DAPI (blue) from 7-day-old control flies (Hand-Gal4) (G), flies with cardiomyocyte-specific overexpression of Sna (Hand>sna+) (G’), and flies with cardiomyocyte-specific knockdown of Snail TF genes (Hand>esgRNAi; snaRNAi) (G”). For each genotype, 6 fat bodies were analyzed. Scale bar represents 20 μm. (H) Steady-state ATP level in the fat bodies of 7-day-old control flies (Hand-Gal4), flies with cardiomyocyte-specific overexpression of Sna (Hand>sna+), and flies with cardiomyocyte- specific knockdown of Snail TF genes (Hand>esgRNAi; snaRNAi). Results are the mean ± SEM of fat bodies isolated from 30–40 flies analyzed over 3 independent experiments and are expressed as the fold change compared with control fat bodies (set to 1.0). (I) Oxygen consumption rate in fat bodies from 3–4 day-old control flies (Hand-Gal4) and flies with cardiomyocyte-specific overexpression of Sna (Hand>sna+). Fat bodies from 15 adult flies were used per well. Oligomycin (final 10μM), FCCP (final 0.4μM), Rotenone (final 3μM) and Antimycin (final 12μM) were added at the indicated time point. Data points are represented as mean ± SEM. (J) Basal and Maximal (Max) rate of respiration in fat bodies from 3–4 day-old control flies (Hand-Gal4) and flies with cardiomyocyte-specific overexpression of Sna (Hand>sna+).

