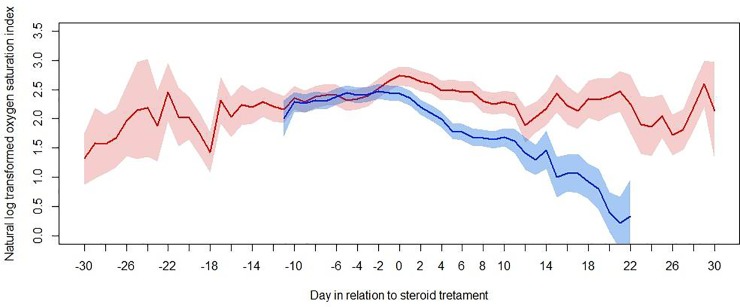
Fig 2. In Oxygen Saturation Index before and after steroid therapy in survivors and non- survivors.
Mean and 95% CI calculated using a multi-level linear regression model with OSI (log transformed) as the dependent variable, days post admission as the fixed effect variable, and patient identifier as the random effect variable.

