
Figure 2.
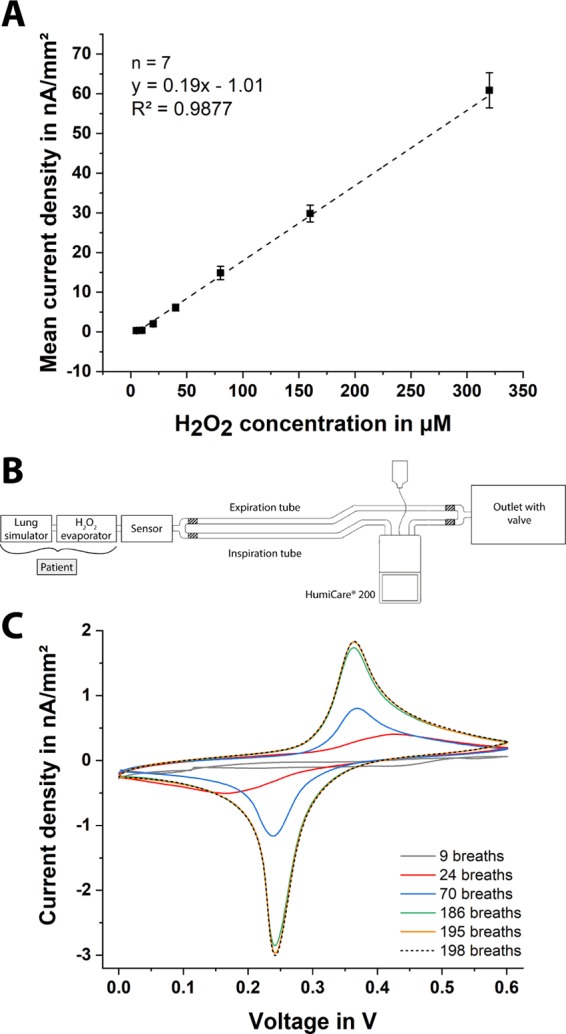
(A) Calibration curve of the paper-based H2O2 sensors with different hydrogen peroxide concentrations: 5–320 μM H2O2 in 1 M KCl solution. Herein, the frontside of the chip was insulated with an adhesive tape since the sensor is placed into the filter with the backside toward the patient, and thus, the frontside of the electrodes has no direct contact with the exhaled breath. Error bars represent ±standard deviation (SD) of n = 7 replicates. (B) Scheme of measurement setup for simulation of respiration, including a lung simulator, a humidifier, a H2O2 evaporator, and a filter housing with an integrated H2O2 sensor. (C) Cyclic voltammograms of a dry chip with a PB-coated working electrode, pretreated with 1 M KCl, in vapor after 9 (gray), 24 (red), 70 (blue), 185 (green), 195 (orange), and 198 (black, dashed) breaths at a scan rate of 100 mV s–1.