
FIG 1.
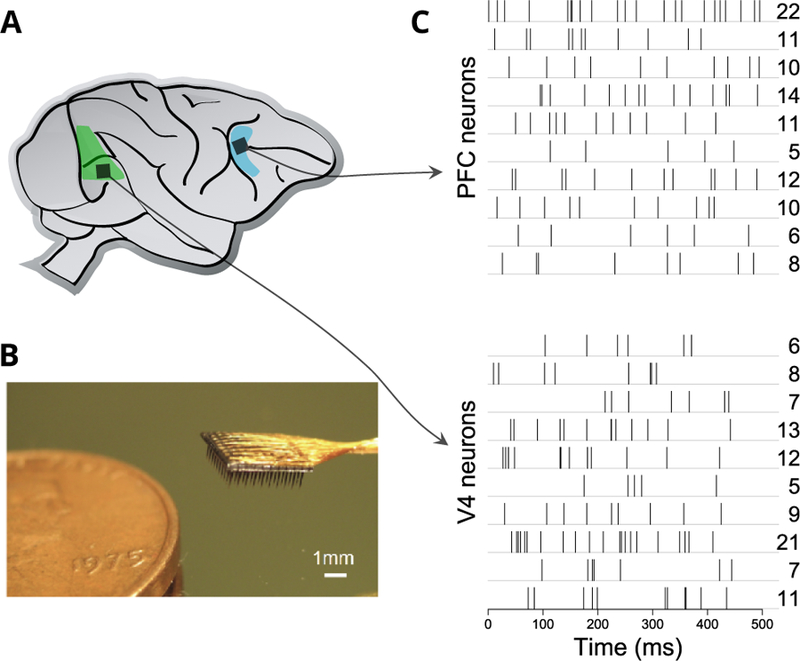
(A) Sketch of primate brain with the approximate recorded regions of prefrontal cortex (PFC) and visual area V4 indicated in blue and green, respectively. (B) Utah array with 10×10 recording electrodes shown next to a penny to compare sizes. Utah arrays implanted in each of PFC and V4 of a non-human primate recorded the spikes of neurons. (C) In each trial of the experiment, spike trains of V4 and PFC neurons were recorded simultaneously. Each row in the diagram is the spike train for one neuron in a particular trial, with spike times being indicated as vertical tick marks. The spike counts over the 500 ms are shown on the right.