
FIG 3.
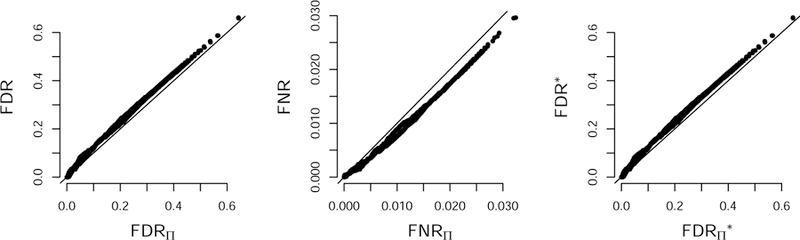
Bayesian FDRΠ, FNRΠ, and plotted against their frequentist counterparts. Results obtained from simulated d-dimensional Gaussian vectors, d = 150, with 5580 edges and sample size n = 5000. The error rates were computed from (p, δ)-graph estimates (Definition 3).