
FIG 6.
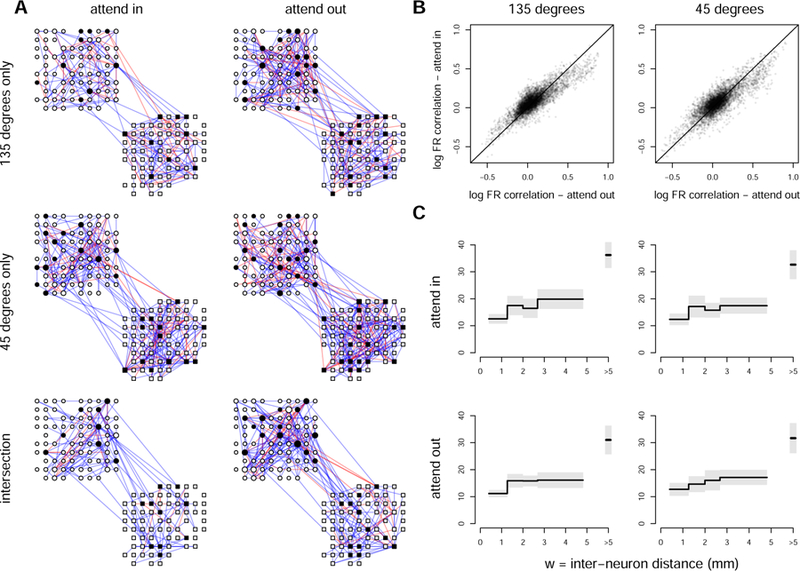
(A) Functional connectivity graphs of log firing rates of neurons in PFC (round nodes) and V4 (squared nodes); 5% Bayesian FDR∗ (Equation 3.26, Section 3.3; (p, δ)-graphs where δ was taken to be equal to the largest of the 20th percentiles of the magnitudes of the partial correlation estimates across the four conditions). We show edges that appear only at orientation 135 degrees but not at 45 degrees, only at orientation 45 degrees but not at 135 degrees, and edges that appear for both orientations. Blue and red edges are positive and negative connections, respectively; we blackened the nodes that connect the two areas. (B) Correlations of log firing rates of the fitted PLN models under the attend in and attend out conditions, for both orientations, among pairs of neurons for which one neuron is in V4 and the other is in PFC. The magnitudes of correlations tend to be diminished for the attend in condition (95% confidence intervals for the linear regression slopes of attend in on attend out correlations are [0.74, 0.76] and [0.75, 0.77], respectively). (C) The estimated function g (Equation 2.5) with 95% posterior intervals. The function increases with inter-neuron distance W in all conditions, which implies a stronger penalization on partial correlations for pairs of neurons that are further apart.