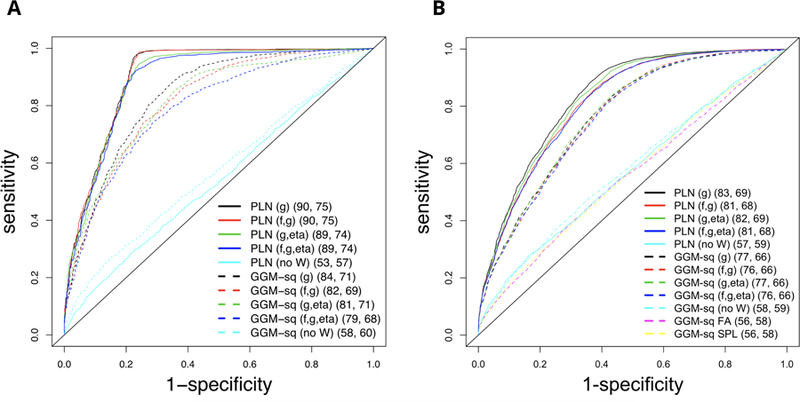
FIG 8.

ROC curves for firing-rate graph estimation based on Poisson-lognormal (PLN) and GGM applied to square rooted spike counts (GGM-sq), averaged across repeat simulations, in the case of a fully recorded network of 50 neurons (A) and a network with 50 recorded and 10 latent neurons (B). The first set of parentheses indicates which functions of W were fitted in the adjusted regularization; the second set contains the area under the curve (AUC) and rescaled volume under the surface (VUS, Section 3.5), averaged across repeat simulations.
