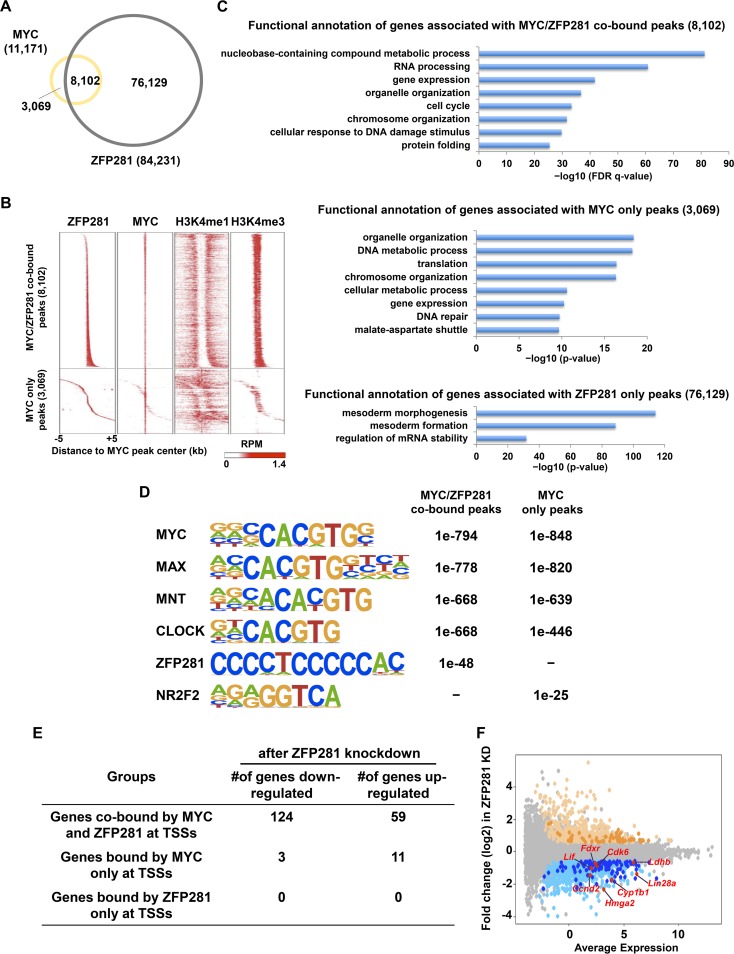
FIG 3.
ZFP281 and MYC cooccupy a subset of promoters in mouse ES cells. (A) Venn diagram showing the overlap between ZFP281 and MYC binding sites in mouse ES cells. (B) Heat maps of the binding profiles in mouse ES cells for ZFP281, MYC, H3K4me1, and H3K4me3 within 5 kb of the center of the MYC peaks, which were partitioned into the MYC/ZFP281-cobound group and the MYC-only group, are shown. RPM, numbers of reads per million. (C) Functional annotation of the MYC/ZFP281-cobound peaks (top), the MYC-only peaks (middle), and the ZFP281-only peaks (bottom), as reported by GREAT. The P value was used to determine the significance of the enrichment of terms. (D) The overrepresented motifs in both the MYC/ZFP281-cobound peaks and the MYC-only peaks are shown. The statistical significance (P value) of the overrepresentation of the motifs in each group is shown. (E) Table showing the numbers of genes downregulated after ZFP281 knockdown in the different groups. (F) Gene expression MA plot showing the differential expression of genes after ZFP281 knockdown (KD) in mouse ES cells. Significantly upregulated genes are shown in light yellow; downregulated genes are shown in light blue. Genes that were cobound by MYC and ZFP281 at their promoters are highlighted by dark yellow and dark blue for upregulated and downregulated genes, respectively. The known MYC target genes Ccnd2, Cdk6, Lif, Lin28a, Fdxr, Cyp1b1, Ldhb, and Hmga2, which were cobound by both MYC and ZFP281 and downregulated after ZFP281 knockdown, are highlighted in red.

