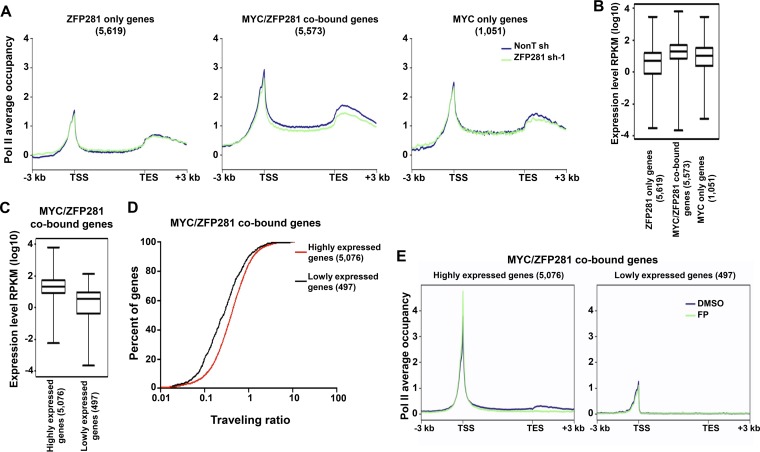
FIG 5.
ZFP281 regulates transcription of the highly expressed MYC/ZFP281-cooccupied genes. (A) Average Pol II binding plots for the ZFP281-only genes (left), the MYC/ZFP281-cobound genes (middle), and the MYC-only genes (right) in control (nonT shRNA) and ZFP281 knockdown (ZFP281 shRNA-1) mouse ES cells. Plots for from 3 kb upstream of the TSS to 3 kb downstream of the transcriptional end site (TES) are shown. (B) Gene expression (in number of reads per kilobase per million [RPKM]) analyses of the ZFP281-only genes, the MYC/ZFP281-cobound genes, and the MYC-only genes. (C) Gene expression (in number of reads per kilobase per million) analyses of the MYC/ZFP281-cobound highly expressed and lowly expressed genes. (B and C) Only genes with statistically sufficient coverage by RNA-Seq are shown. (D) Distribution of the percentage of the MYC/ZFP281-cobound highly expressed and lowly expressed genes with a given traveling ratio. (E) Average Pol II binding plots for the MYC/ZFP281-cobound highly expressed genes (left) and the MYC/ZFP281-cobound lowly expressed genes (right) in DMSO- and flavopiridol (FP)-treated mouse ES cells. Plots for the regions from 3 kb upstream of the TSS to 3 kb downstream of the transcriptional end site are shown.

