FIG 4.
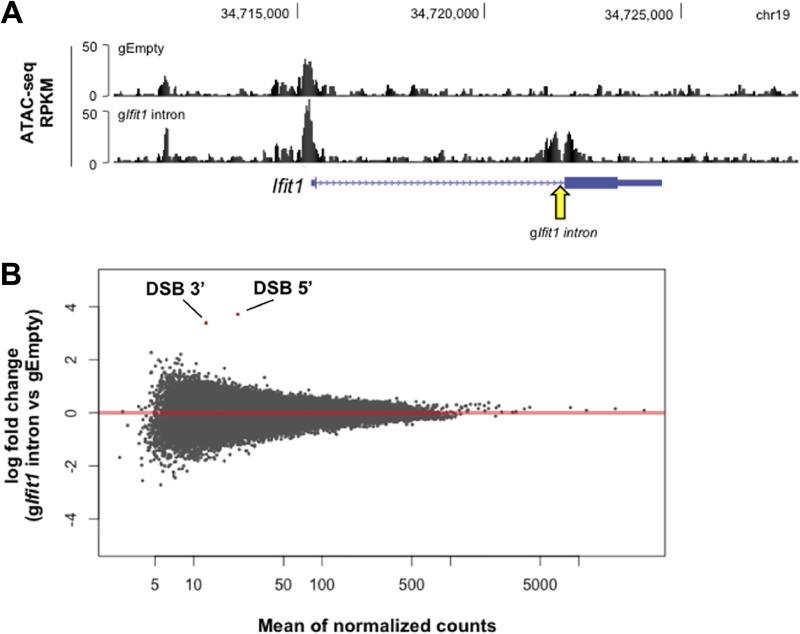
DSB-induced changes in chromatin accessibility are limited to the break site itself. (A) UCSC Genome Browser screenshot depicting the ATAC-seq signal at the Ifit1 locus in G1-arrested LigIV−/− v-Abl-transformed pre-B cells nucleofected with gEmpty (top track) and the gIfit1 intron (bottom track) and treated with IFN-β, as outlined in Fig. 3I. The arrow denotes the gIfit1 intron target site. (B) Plot depicting the log2 fold change of the read counts for each ATAC-seq peak and the mean of the normalized read counts for each peak between cells nucleofected with gEmpty and cells nucleofected with the gIfit1 intron and treated with IFN-β, as outlined in Fig. 3I (results are averages from three biological replicates [n = 3]). Each dot represents an individual ATAC-seq peak. Two peaks (indicated in red) are called significantly different by the DESeq2 program (Wald test, P < 0.05) and correspond to the peaks on either side of the Ifit1 intronic DSB, as visualized in panel A.

