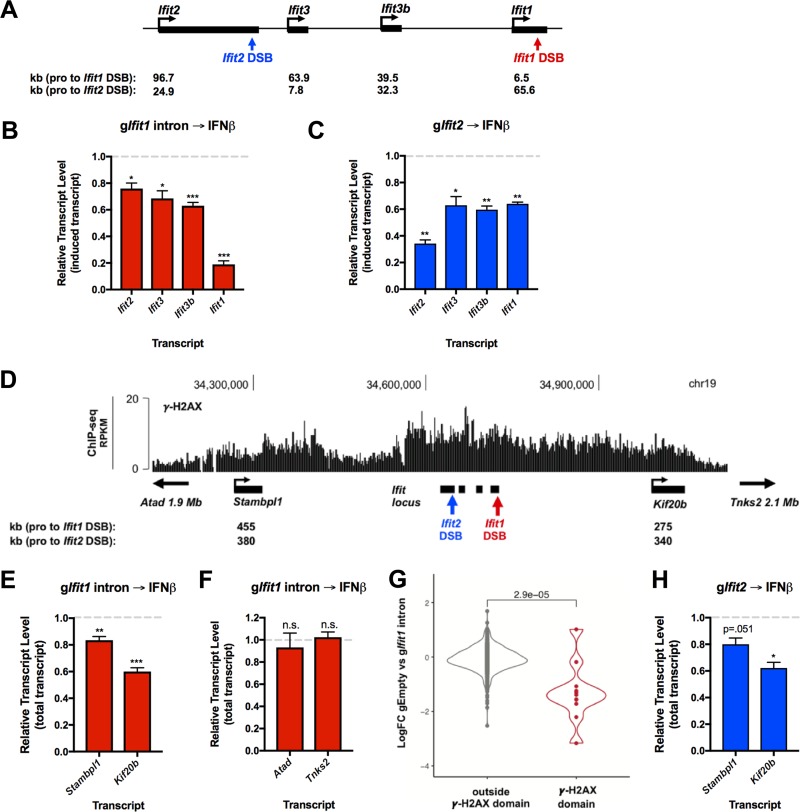
FIG 5.
DSB-dependent transcriptional repression spreads to distal genes within the γ-H2AX domain. (A) Schematic of the Ifit locus. IFN-β-inducible genes (ISGs) are shown in black. The gIfit1 intron break site and the gIfit2 break site are denoted in red and blue, respectively. The distances from the promoters of each ISG and each DSB site are indicated below. (B) RT-qPCR analysis of induced transcript levels of Ifit locus ISGs in cells nucleofected with the gIfit1 intron. Transcript levels are shown relative to the levels in cells nucleofected with gEmpty and treated with IFN-β, as outlined in Fig. 3I. (C) RT-qPCR analysis of induced transcript levels of Ifit locus ISGs in cells nucleofected with gRNA targeting Ifit2 exon 3 (gIfit2). Transcript levels are shown relative to the levels in cells nucleofected with gEmpty and treated with IFN-β, as described in the legend to panel B. (D) UCSC Genome Browser screenshot depicting the γ-H2AX ChIP-seq signal at the Ifit locus in LigIV−/−:iCas9 cells at 24 h after nucleofection with the gIfit1 intron. Distal genes lying within the γ-H2AX domain are shown in black. The gIfit1 intron break site and the gIfit2 break site are denoted in red and blue, respectively. The distances from the promoters of each distal gene and each DSB site are indicated below. (E) RT-qPCR analysis of the total transcript levels of distal genes Stambpl1 and Kif20b from the experiments whose results are presented in panel B. (F) RT-qPCR analysis of total transcript levels of Atad and Tnks2 from the experiments whose results are presented in panel B. Atad and Tnks2 are located upstream and downstream of the Ifit1 DSB γ-H2AX domain, respectively. (G) Violin plot showing the mean log2 fold change of expression between cells nucleofected with gEmpty and cells nucleofected with the gIfit1 intron and treated with IFN-β, as outlined in Fig. 3I. Genes located within and outside the chromosome 19 Ifit1 γ-H2AX peaks (D) are shown in red and gray, respectively. Each dot represents an individual gene. The Wilcoxon test was used to generate the P value. (H) RT-qPCR analysis of the total transcript levels of distal genes Kif20b and Stambpl1 in cells nucleofected with gRNA targeting Ifit2 exon 3 (gIfit2) from the experiments whose results are presented in panel C. The data in panels B, E, and F represent those from 4 independent experiments (n = 4), the data in panels C and H represent those from 3 independent experiments (n = 3), and the data in panel G represent those from 1 biological replicate (n = 1). Error bars show the SEM. *, P < 0.05; **, P < 0.01; ***, P < 0.001; n.s., not significant.

