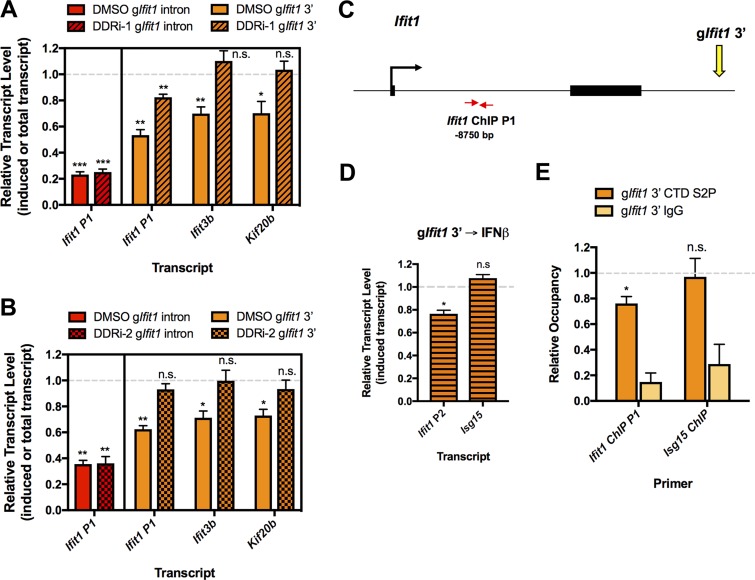
FIG 6.
DSB-induced gene silencing depends on the DNA damage response and reduced RNAPII activity. (A) RT-qPCR analysis of the induced Ifit1 transcript in cells nucleofected with the gIfit1 intron and of the induced Ifit1 and Ifit3b transcript and the total Kif20b transcript in cells nucleofected with gIfit1 3′. Cells were nucleofected and then transferred to medium containing DMSO or an ATM inhibitor (KU55933) and DNA-PKcs inhibitor (NU7026) (the DDRi-1 treatment) and treated with IFN-β, as outlined in Fig. 3I. Transcript levels in samples treated with DMSO or the DDRi are shown relative to the levels in cells nucleofected with gEmpty and treated with DMSO or DDRi, respectively. (B) RT-qPCR analysis, as described in the legend to panel A, for cells treated with DMSO or an ATM inhibitor (KU60019) and DNA-PKcs inhibitor (NU7441) (the DDRi-2 treatment). (C) Schematic depicting the Ifit1 locus, gIfit1 3′ target site, and Ifit1 qPCR primer locations used for the ChIP analysis whose results are presented in panel E. The distance from the primers to the Ifit1 3′ gRNA target site is indicated. (D) RT-qPCR analysis of induced transcript levels of Ifit1 (primer pair Ifit1 P2) and Isg15 at 26 h after nucleofection with gIfit1 3′. Cells were treated with 100 U/ml IFN-β for 2 h at 24 h after nucleofection. Transcript levels are shown relative to the levels in cells nucleofected with gEmpty and treated with IFN-β. (E) ChIP analysis of RNAPII CTD S2P occupancy in the Ifit1 gene from the experiments whose results are presented in panel D. RNAPII levels are presented relative to the levels in cells nucleofected with the empty gRNA vector (no DSBs). The relative RNAPII CTD S2P occupancy at the undamaged Isg15 locus is shown as a control. The data in panel A represent those from 4 independent experiments (n = 4), the data in panel B represent those from three independent experiments (n = 3), and the data in panels D and E represent those from 3 independent experiments (n = 3). Error bars show the SEM. *, P < 0.05; **, P < 0.01; ***, P < 0.001; n.s., not significant.

