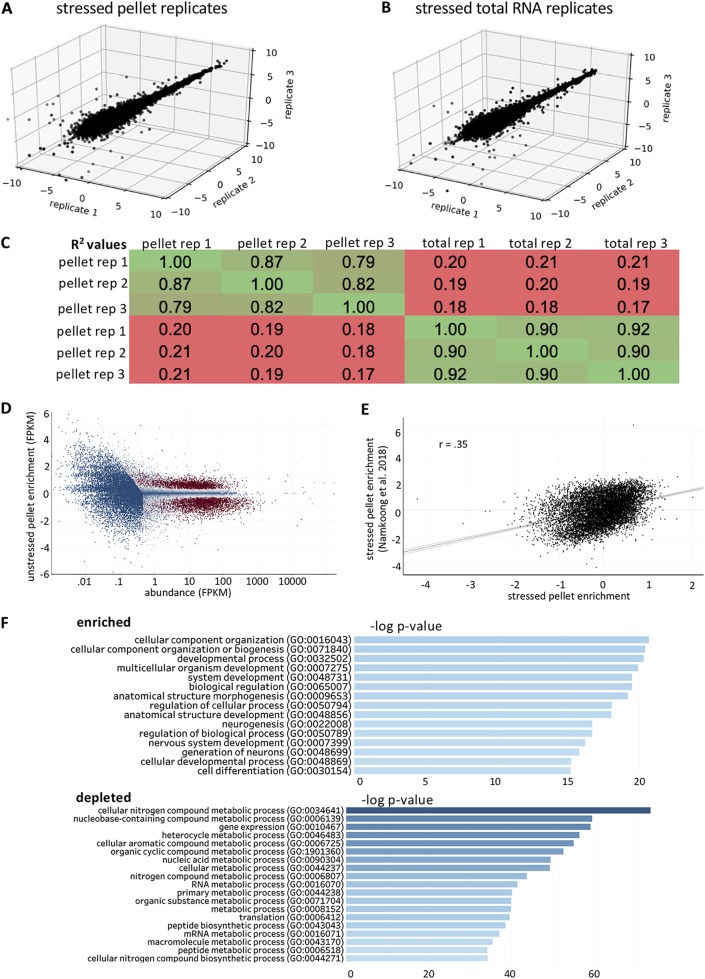
FIG 3.
Stressed RNA granule pellet transcriptomes are reproducible. (A) 3D scatterplot depicting the normalized read counts from RNA-seq libraries from stressed RNA granule pellet triplicates. (B) 3D scatterplot depicting the normalized read counts from RNA-seq libraries from stressed total RNA triplicates. (C) Table depicting pairwise Pearson correlation coefficients between RNA granule pellets and total RNA in stressed cells. (D) MA plot depicting the log2 fold change values (stressed RG pellet/stressed total RNA) versus abundance (FPKM). Genes are color-coded by their significance. Significant genes (P < 0.01) are colored red, while nonsignificant (P > 0.01) genes are colored blue. (E) Scatterplot of stressed RG enrichment obtained from mouse fibroblasts versus stressed RG enrichment in U-2 OS cells. (F) Gene ontology for enriched and depleted transcripts.

