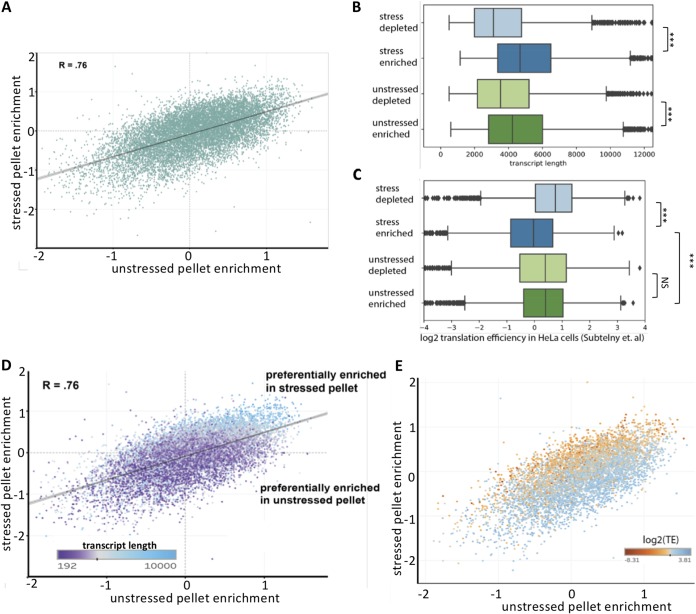
FIG 4.
Characterization of the stressed RNA granule pellet. (A) Scatterplot depicting the correlation between stressed pellet enrichment versus unstressed pellet enrichment. (B) Box plots showing transcript lengths for pellet-enriched and pellet-depleted transcripts during arsenite stress and unstressed conditions. (C) Same as panel B but for translation efficiency (TE) values (obtained from Subtelny et al. [18]). (D) Same as panel B but color-coded by transcript length. (E) Same as panel B but color-coded by TE values.

