. 2019 Oct 14;8:e48914. doi: 10.7554/eLife.48914

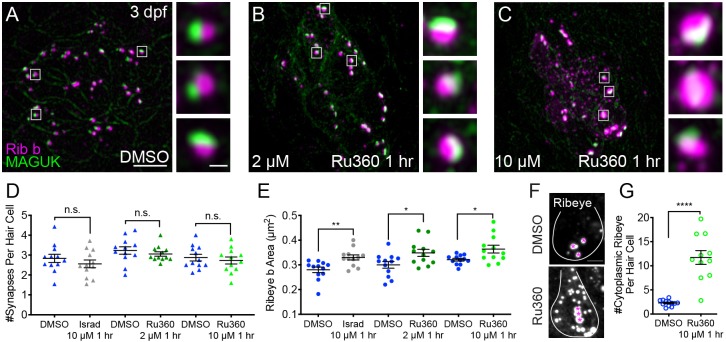
Figure 5. Mito-Ca2+ regulates ribbon formation.

(A-C) Representative images of immature neuromasts (3 dpf) immunostained with Ribeye b (magenta, ribbons) and MAGUK (green, postsynapses) after a 1 hr 0.1% DMSO (A), 2 μM Ru360 (B) or 10 µM Ru360 (C) treatment. Insets show three representative synapses (white squares) for each treatment. D-E, Scatter plot show quantification of synapse number (D), and ribbon area (E) in controls and in treatment groups. (F) Side-view of 2 hair cells (white outline) shows synaptic ribbon (three magenta asterisks in each cell) and extrasynaptic Ribeye b aggregates after a 1 hr 0.1% DMSO or 10 μM Ru360 treatment. (G) Quantification of extrasynaptic Ribeye puncta. N ≥ 12 neuromasts per treatment. Error bars in D-E and G represent SEM. An unpaired t-test was used in D and a Welch’s unequal variance t-test was used in E and G, *p<0.05, **p<0.01, ****p<0.0001. Scale bar = 5 µm in A, 2 µm in insets and F.

Figure 5—source data 1. Summary of synapse number and ribbon area after Ru360 application in developing hair cells.

Figure 5.

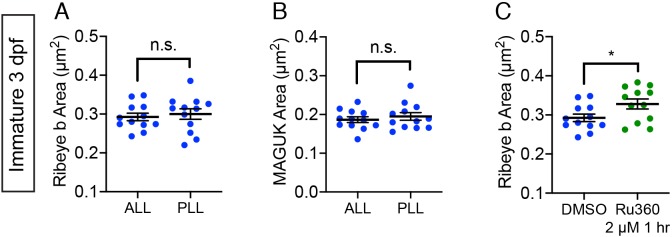
Figure 5—figure supplement 1. Ribbon and postsynapse size in immature ALL neuromasts.

Figure 5—figure supplement 1.

(A-B) Scatter plots show that ribbon areas (A) and postsynaptic density areas (B) within the same fish are similar between immature anterior lateral-line (ALL) and posterior lateral-line (PLL) neuromasts. (C) Scatter plots show ribbon areas in controls and after a 1 hr treatment with 2 µM Ru360 are larger in immature hair cells within the ALL. Ribbon sizes of untreated anterior lateral-line hair cells are from the same data as A and C, n ≥ 10 neuromasts per treatment; error bars represent SEM; and a Welch’s unequal variance t-test was used for comparisons. *p<0.05.
Figure 5—figure supplement 1—source data 1. Summary of data comparing anterior and posterior lateral-line synapses in developing hair cells.
Figure 5—figure supplement 2. MCU and CaV1.3 block do not impact postsynapse size.
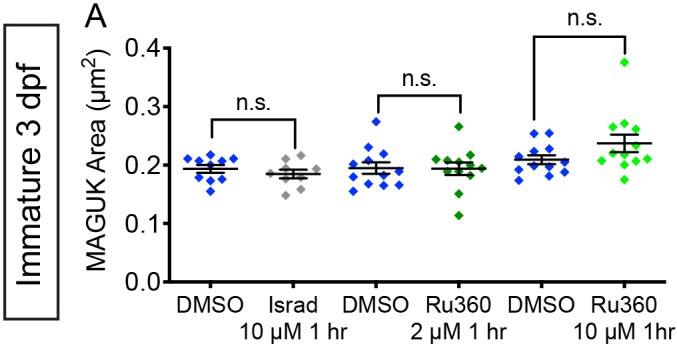
Figure 5—figure supplement 2.

(A) Quantification of postsynapse size assayed by MAGUK immunolabel in mature neuromasts indicate the treatments with 10 µM isradipine, 2 µM Ru360 and 10 µM Ru360 do not significantly alter postsynapse size compared to controls, n ≥ 9 neuromasts per treatment. Error bars represent SEM. A Welch’s unequal variance t-test was used for comparisons.
Figure 5—figure supplement 2—source data 1. Summary of MAGUK area measurements after Ru360 treatment in developing hair cells.