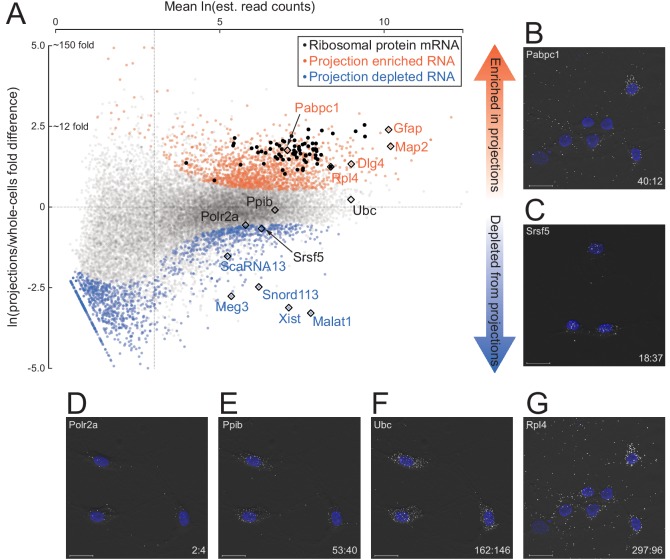
Figure 2. Quantitative analysis of RNA localization.
(A) Scatter plot comparing log mean read counts and log fold difference in projections versus whole cells, for 19,815 RNA transcripts with non-zero read counts. 1440 (orange dots) are significantly enriched (q-value < 0.01 and fold-change > 1.5) in projections, 1486 (blue dots) are enriched in whole cells, and 16,899 (gray dots) show no significant enrichment in either sample. Ribosomal protein encoding RNAs are shown as black dots; rhombi enclose labeled RNAs. (B–G) smFISH validation of examples of projection-localized (B) versus projection-depleted (C), and low (D), medium (E), high (F), and higher (G) abundance mRNAs. Upper left corner shows gene name, lower right corner shows projection:whole cell TPM. Scale bars = 20 μm.
Figure 2—figure supplement 1. Correlation between RNAseq from biological replicates.

Figure 2—figure supplement 2. Gene ontology classes enriched in projections and whole cells.


