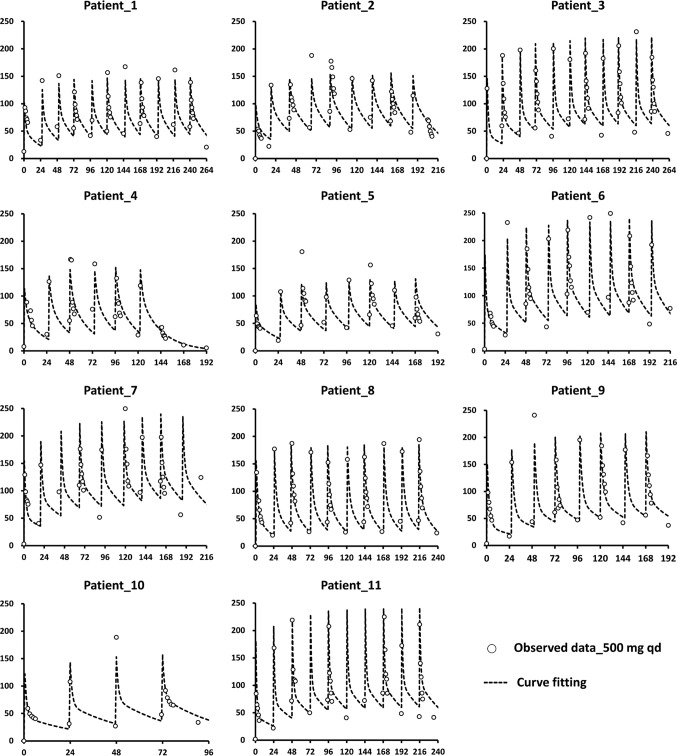
FIG 1.
Curve fitting of total ertapenem plasma concentrations in HD patients (n = 11) after multiple-dose regimens. Ertapenem at 500 mg was administered daily to patients via 30-min intravenous infusion. The vertical axis in each diagram indicates the ertapenem plasma level (milligram per liter), and the horizontal axis indicates the time (hours). The observed data are represented by open circles, and the fitted results are depicted with dotted lines. Patients 4 and 6 developed central nervous system toxicity, presenting as self-talking and visual hallucinations, after the seventh and ninth consecutive daily doses of 500 mg ertapenem, respectively.

