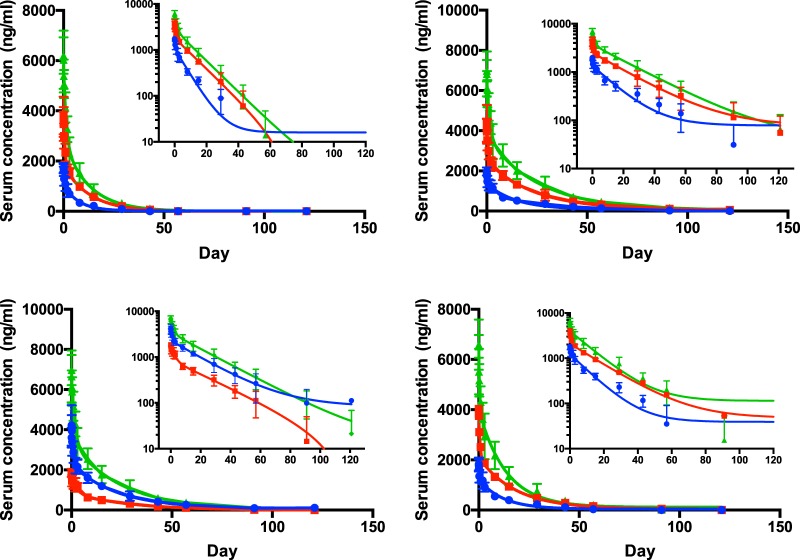
FIG 2.
Serum concentration over time means from 6 subjects (error bars indicate standard deviations) at three dosing levels: 0.33 mg/kg (blue), 0.66 mg/kg (red), and 1 mg/kg (green). Curves are least-square best fit; for all curves, R2 ≥ 0.9. Curves are least-squared fits and do not converge at zero antibody concentration in log scale as a result of the lower limit of quantitation of the assay being 10 ng/ml and the lack of sampling after 150 days. (A) MAb XCD-a. (B) XCD-b. (C) XCD-c. (D) XCD-d.

