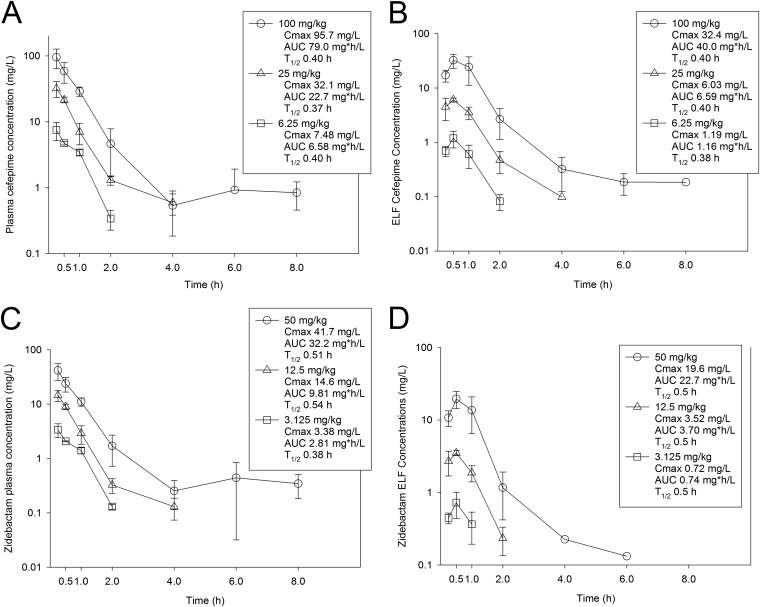
FIG 1.
Plasma and ELF drug concentration-time curves for cefepime (A and B, respectively) and zidebactam (C and D, respectively). Groups of three mice per time point were administered single subcutaneous doses of cefepime or zidebactam. At 7 different time points, plasma and BAL fluid samples were collected and assayed by liquid chromatography-tandem mass spectrometry (LC-MS/MS) techniques. ELF concentrations were determined using the urea correction method. Each symbol represents the mean ± standard deviation (SD) of results from three animals. The maximum concentration (Cmax), the area under the drug concentration from 0 h to infinity (AUC), and the elimination half-life (T1/2) are shown for each dose.

