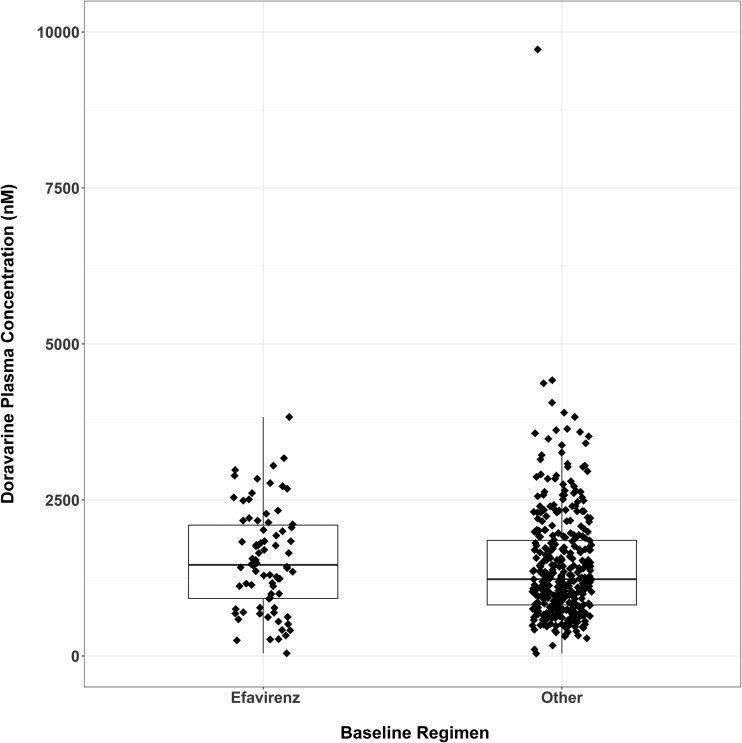
FIG 1.
DOR plasma concentrations collected at study week 4 (before dosing) according to the baseline regimen (efavirenz versus other) in the ISG. The boxplot was overlaid with observed data points. Boxes denote 25th, 50th, and 75th percentiles, and the whiskers denote 1.5 times the interquartile range of distribution of predose samples.

