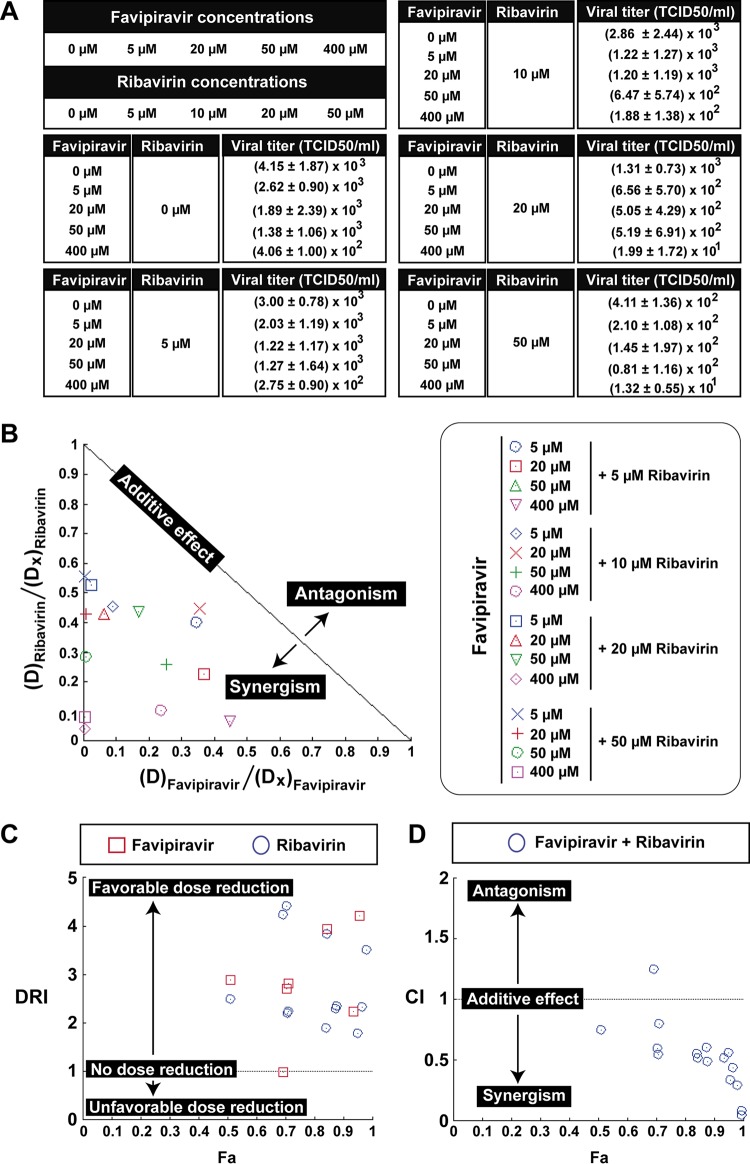
FIG 1.
Synergistic activity of favipiravir and ribavirin against hepatitis C virus. (A) Infectious progeny production of HCV p0 upon infection of Huh-7.5 reporter cells. Values and standard deviations (from triplicate determinations) are given. (B) Dose-normalized isobologram for the nonconstant ratio combinations. The combination data points that fall on the hypotenuse indicate an additive effect, those that fall on the lower left indicate synergism, and those that fall on the upper right indicate antagonism. The program excluded the representation of the point corresponding to 50 μM favipiravir and 5 μM ribavirin. D, dose; Dx, dose of a single drug that exhibits a given percent inhibition. (C) Dose reduction index (DRI) for each drug for a given effect (Fa). DRI of >1, 1, and <1 indicate a favorable dose reduction, no dose reduction, and a negative dose reduction, respectively. Values larger than 5 are not represented in the plot. (D) Combination index (CI) values as a function of the effect levels (Fa), where CI values of <1, 1, and >1 indicate synergism, an additive effect, and antagonism, respectively. Panels B to D were obtained by analysis with CompuSyn software. The procedures are detailed in Materials and Methods.

