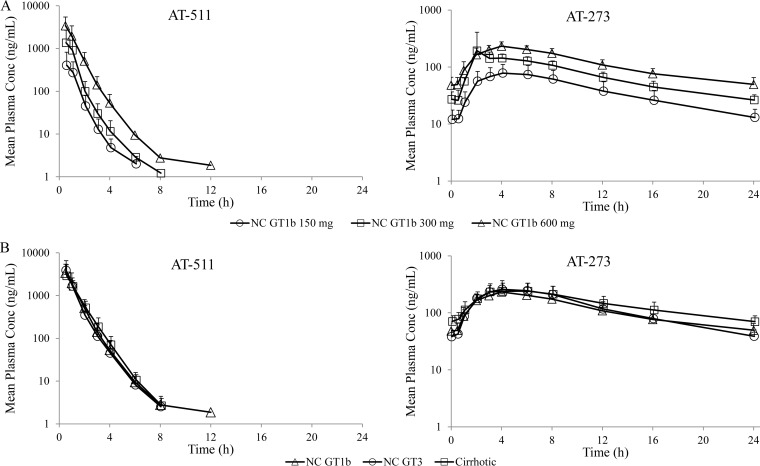
FIG 2.
Mean (+SD) steady-state plasma concentration-time profiles of AT-511 and AT-273 on day 7. (A) Ascending doses of 150, 300, and 600 mg QD (6 subjects per dose) in noncirrhotic (NC) GT1b subjects. (B) AT-527 600 mg QD in NC GT1b (n = 6), NC GT3 (n = 6), and cirrhotic (GT1, -2, or -3; n = 6) subjects.

